In a world flooded with sleek, dedicated project management apps, it might seem odd that so many sharp HR and finance managers still swear by Microsoft Excel. Why stick with a spreadsheet when specialized software is just a click away?
The answer is beautifully simple: familiarity, accessibility, and control.
Excel is the workhorse tool that’s already on virtually every computer in your organization. There’s no new software to buy, no painful onboarding process, and no confusing interface to master. For an HR manager tracking a recruitment pipeline or a finance pro overseeing a quarterly audit, this instant usability is a massive win. The learning curve is almost flat for anyone who’s spent time in a spreadsheet. And for those who need a refresher, a solid Excel training for beginners can get you up to speed in no time.
Playing to Its Strengths (and Knowing Its Weaknesses)
Let’s be clear: choosing Excel is often a strategic move. It shines for projects with clear, straightforward needs. Think departmental budgets, small team event planning, or tracking the phases of an internal review. Its grid-based logic is perfect for lists, calculations, and organizing data without any fuss.
However, you have to be realistic. Excel wasn’t designed to handle sprawling, multi-team projects that demand real-time collaboration or complex task dependencies. Still, its staying power is incredible. Even as the project management software market grows, only about 23% of organizations actually use a dedicated PM tool. That leaves a huge majority leaning on familiar tools like Excel.
The real skill is knowing when to use Excel. It’s not about choosing an outdated tool; it’s about picking the right tool for the job. For many internal projects, its simplicity is a feature, not a bug.
Before we dive in, let’s quickly stack Excel up against dedicated project management software. This isn’t about one being “better” than the other, but about understanding where each one fits best.
Excel vs Dedicated PM Software at a Glance
| Feature | Excel | Dedicated PM Software |
|---|---|---|
| Cost | Usually included with Microsoft Office suite | Subscription-based (monthly/annual fees per user) |
| Learning Curve | Low; high familiarity for most users | Moderate to high; requires training and adoption |
| Collaboration | Limited; requires manual sharing | Built-in real-time collaboration and communication |
| Automation | Manual setup with formulas and macros | Advanced automated workflows and notifications |
| Reporting | Customizable but manual dashboard creation | Pre-built, dynamic, and automated reports |
| Task Dependencies | Possible, but requires complex formulas | Natively supported and easy to manage |
Seeing the comparison laid out like this makes it obvious: for simpler, internal projects where you already have the tool and the skills, Excel is a powerful and logical choice.
This guide is for those of you who want to make the most of the tool you already know and trust. We’re going to show you how to turn that familiar spreadsheet into a command center for your projects, moving you beyond basic to-do lists to dynamic trackers and insightful dashboards.
Building Your Foundational Project Tracker

Alright, enough theory. Let’s roll up our sleeves and actually build the core of your project management system in Excel. We’re going to start with a completely blank sheet and turn it into a powerful, simple project plan. This isn’t just a one-off tool; think of it as a reusable blueprint for everything from onboarding a new hire to managing a quarterly financial audit.
The real beauty of using Excel is its straightforward nature and how you can mold it to your exact needs. Forget about those complicated software packages with a million features you’ll never touch. We’re zeroing in on what actually matters for clear, effective tracking.
Defining Your Core Columns
Every solid project tracker I’ve ever built starts with the same handful of essential columns. These are your non-negotiables—the data points that bring structure and clarity to any project, whether you’re in HR or finance. You can always tack on more later, but these five are where success begins.
- Task Name: Be specific and action-oriented. “Draft Q3 Financial Report” is infinitely better than just “Report.”
- Owner: Who, specifically, is on the hook for this? Assigning a single person eliminates the “I thought you were doing it” dance and builds accountability.
- Start Date: The day the work is scheduled to kick off.
- End Date: The absolute deadline for getting it done.
- Status: A simple, real-time snapshot of where things stand.
Just with this structure, you get an immediate at-a-glance overview of who is doing what, by when, and how it’s going. It’s the skeleton that we’ll build everything else on.
Adding Automation and Consistency
Now for the fun part: making the tracker work for you. Manually typing a status like “In Progress” or “Done” is a recipe for typos and inconsistencies down the road. A much cleaner way is to use Excel’s Data Validation feature to create dropdown menus.
Here’s how: just select your ‘Status’ column, head over to the ‘Data’ tab, and click ‘Data Validation’. From there, choose ‘List’. In the source box, you can type your options directly, separated by commas: Not Started,In Progress,Completed,On Hold. This simple move prevents errors and makes filtering your data a thousand times more reliable.
Pro Tip: Keep your status options simple. I’ve seen trackers get bogged down with too many choices. Stick to three or four clear statuses that everyone on the team understands. It makes reporting way less of a headache.
We can also get clever with formulas. Want to see how long each task should take? Add a ‘Duration’ column and pop in a simple formula like =END_DATE - START_DATE. If your ‘End Date’ is in cell D2 and ‘Start Date’ is in C2, your formula would just be =D2-C2.
Excel really starts to shine when you use formulas to track progress. For instance, a formula like =COUNTIF(F2:F100,"Completed")/COUNTA(F2:F100) gives you a live percentage of how many tasks are complete. For more ideas on what’s possible, you can find a good rundown of powerful Excel formulas on kanbanchi.com. Once this is set up, you’ll have a tangible, reusable template that will become the backbone of all your project tracking.
Visualizing Timelines with a Dynamic Gantt Chart
A well-organized list of tasks and deadlines is the engine of your project, but a visual timeline is the GPS that shows everyone the road ahead. For stakeholders, a Gantt chart transforms a complex schedule into an instantly understandable story. This is where we elevate your spreadsheet from a simple tracker into a powerful communication tool, all without needing any special add-ins.
The secret to a professional-looking Gantt chart in Excel lies in a clever workaround using a stacked bar chart. It might sound a bit technical, but it’s surprisingly straightforward. The result is a dynamic visual that updates automatically as your project dates change—a total game-changer when you’re managing timelines for something like a fiscal year-end closing process or a multi-stage employee performance review cycle.
Setting the Stage for a Stacked Bar Chart
First things first, we need to prep our data. The chart will pull directly from the project tracker we’ve already built, but it needs one extra piece of information to work its magic: task duration.
If you haven’t already, just add a “Duration” column next to your “Start Date” and “End Date.” The formula is as simple as it gets: =[End Date] - [Start Date]. This quick calculation gives us the number of days for each task, which is exactly what our chart needs to visualize the length of each bar.
With that small addition, your data is ready to go. You’ll only need three columns to build the chart:
- Task Name
- Start Date
- Duration
That’s all the fuel Excel needs to start building your visual timeline.
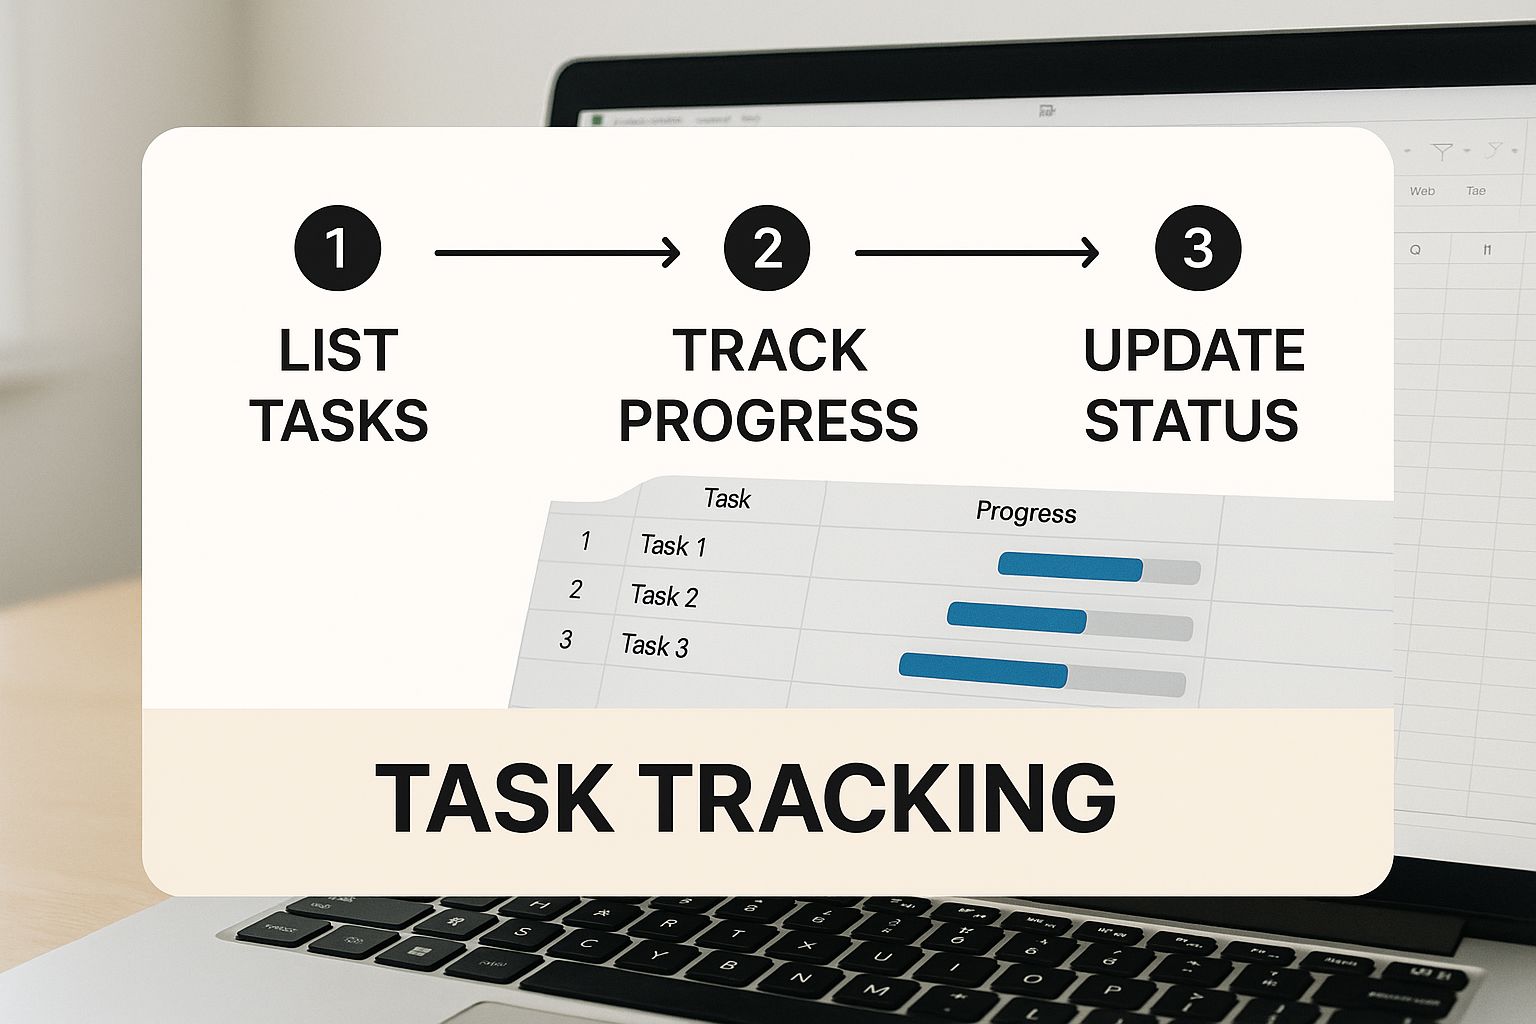
As you can see, a clean, organized structure is the foundation. Laying out your tasks, dates, and progress clearly is crucial before you even think about visualization.
Bringing the Gantt Chart to Life
Now for the fun part. Select your task data—and make sure you include the headers for Task Name, Start Date, and Duration. Head over to the Insert tab and choose a 2-D Stacked Bar Chart.
Don’t panic if it looks like a mess at first. It’s supposed to. It won’t look anything like a Gantt chart just yet. The real transformation happens with a bit of formatting. Our goal is to make the first part of each bar—the part representing the start date—completely invisible.
Just right-click on the blue bars (or whatever color represents your ‘Start Date’ data) and select “Format Data Series.” In the panel that opens, go to the “Fill & Line” section (it looks like a paint bucket) and choose “No fill.” And just like that, the colored bars for your task durations will seem to float, creating that classic Gantt chart look.
Your project timeline is now a living visual. When you update a start date or end date in your data table, the bars on the chart will automatically resize and shift, keeping your visual perfectly in sync with your plan.
There’s one final, critical tweak. By default, Excel will list your tasks from bottom to top, which is the opposite of what you want. To fix this, right-click on the list of tasks on the vertical axis (the Y-axis), choose “Format Axis,” and in the Axis Options, check the box that says “Categories in reverse order.”
With these few steps, you’ve turned a static spreadsheet into a dynamic and professional project management visual.
Effectively Tracking Budgets and Resources
Let’s be honest, a brilliant project plan is just a nice-looking document without the right people and money to make it happen. For any manager in finance or HR, this is where the rubber meets the road. Tracking your team’s workload and the project’s budget is non-negotiable.
This is the point where you need to move beyond a single, monolithic project plan. It’s time to build out dedicated worksheets for your people and your money. We’re not just making more lists here; we’re creating an interconnected system. Your main project tracker tells you what needs to be done, while these new sheets will tell you who is doing it and how much it’s costing—all in real-time.
Mastering Resource Allocation
Let’s start with your most valuable—and often most stretched—asset: your team. The fastest way I’ve seen projects go off the rails is by overloading a key person. It’s a classic bottleneck that’s easy to create and hard to fix once the damage is done.
To get ahead of this, create a new worksheet and call it something like ‘Resource Allocation’.
Inside, you can build a simple table that lists each team member and the number of tasks currently on their plate. You don’t have to count these manually. A simple COUNTIF formula can automate the whole thing.
For example, imagine your main ‘Project Plan’ sheet has the task owner listed in Column B. This formula will instantly tell you how many tasks are assigned to “Jane Doe”:
=COUNTIF('Project Plan'!B:B, "Jane Doe")
Just like that, you have a quick, data-driven view of everyone’s workload. It’s no longer a gut feeling. You can see with cold, hard numbers that one person has 10 tasks while another has only two. This simple check is your first line of defense against burnout and keeps the project humming along.
A project’s success often hinges on managing workload as much as managing work. An automated resource count is your first line of defense against team burnout and bottlenecks.
Designing a Smart Budget Tracker
Now for the money. On another new worksheet, which you can name ‘Budget Tracker’, we’ll create a powerful, real-time view of your project’s financial health. I promise this doesn’t have to be complicated to be incredibly effective.
Start with the essential columns. I’ve used this structure countless times, and it works.
Here is a breakdown of the key columns you’ll want to build for an effective project budget tracker right inside Excel.
Essential Budget Tracking Template Columns
| Column Name | Purpose | Example Formula |
|---|---|---|
| Task/Expense Item | Describes what the money is being spent on. | N/A |
| Budgeted Cost | Your initial estimate for that specific item. | N/A |
| Actual Cost | The real, final amount spent on the item. | N/A |
| Variance | The difference between budget and actual. | =[Budgeted Cost] - [Actual Cost] |
The real magic happens when you link this budget sheet back to your main project plan.
By using a SUMIF formula, your budget tracker can automatically pull in spending data as tasks are updated. For instance, you could set it up to sum all the ‘Actual Costs’ for tasks marked as “Completed.” This creates a living, breathing financial picture of your project.
Instead of waiting for the end of the month to manually reconcile your budget, you get instant feedback every single time a task is finished. For those who want to take this even further, getting into advanced financial modeling, budgeting, and dashboards can open up a whole new world of making your data work for you.
By separating and then linking these critical components, you transform a static Excel plan into a dynamic command center. You’ll have immediate clarity on the two pillars that hold up any successful project: your people and your budget.
Designing an Interactive Project Dashboard

This is where the magic happens. Your project plan, resource tracker, and budget sheet are all powerful tools on their own, but a dashboard is what ties them together into a single, compelling story. The whole point is to create a one-page summary that tells stakeholders everything they need to know at a glance—no wading through endless rows of raw data required.
Think of it as your project’s command center. For a finance manager, it’s the immediate snapshot of budget versus actual spending. For an HR lead, it’s the real-time status of a new hire onboarding process. This is how you elevate complex project data into clear, actionable insights for leadership.
Building Your Key Performance Indicators
The foundation of any good dashboard is its Key Performance Indicators, or KPIs. These are the vital signs of your project, and the best part is they can be calculated automatically with some simple formulas. Instead of manually counting tasks every week, you can let Excel do the heavy lifting.
Go ahead and create a new worksheet and name it something like ‘Dashboard’. Set aside a small area at the top for your main KPIs. Here are a few essential ones you can build right now:
- Overall Progress: This gives you a clear percentage of how many tasks are actually finished. The formula is refreshingly simple:
=COUNTIF('Project Plan'!E:E,"Completed")/COUNTA('Project Plan'!E:E). It just divides the number of completed tasks by the total number of tasks. - Tasks Overdue: This one is my favorite for flagging potential delays before they become major problems. A formula like
=COUNTIFS('Project Plan'!D:D,"<"&TODAY(),'Project Plan'!E:E,"<>Completed")will instantly count any task where the due date has passed but the status isn’t marked “Completed.” - Budget Variance: Absolutely critical for finance folks. A quick subtraction from your budget tracker, like
=SUM(Budget!C:C)-SUM(Budget!B:B), immediately tells you if you’re over or under budget.
A truly great dashboard doesn’t just show data; it answers the most important questions before anyone even has to ask. Focus on the KPIs that tell a story about progress, risk, and financial health.
Creating Dynamic Visuals
With your KPIs in place, it’s time for the fun part: adding visual elements. Charts and graphs make your data so much easier to understand and digest. And since you’ll link these visuals directly to your project plan, they’ll update automatically whenever you change the source data.
A pie chart, for example, is perfect for showing the breakdown of task statuses. Just highlight your status column, navigate to Insert > Pie Chart, and Excel will whip up a visual showing the proportion of tasks that are ‘Completed’, ‘In Progress’, or ‘Not Started’. In the same way, a simple bar chart can brilliantly compare your budgeted costs versus actual spending for each project phase.
These elements come together to create a powerful, self-updating summary. If you really want to get into the weeds, there are some fantastic resources on how to create an Excel dashboard that walk through more advanced techniques. Your finished dashboard becomes the ultimate tool for stakeholder meetings, providing a clear, immediate snapshot of your project’s health.
When Excel Hits a Wall (And It’s Time to Upgrade)
Look, Excel is a powerhouse. For many projects, it’s all you’ll ever need. But we have to be honest about where it falls short. Knowing its limits is the best way to avoid a major headache later on.
If your shared drive is littered with files named Final_Budget_v3_Final_FINAL.xlsx, you’re already caught in one of Excel’s classic traps: version control chaos.
This kind of chaos is usually just the tip of the iceberg. Manual data entry, the lifeblood of any Excel workflow, is a risky game. One tiny typo in a budget or a wrong date in a timeline can create a ripple effect of bad forecasts and blown deadlines. And don’t even get me started on real-time collaboration. Trying to get multiple people to update the same file means you’re either wrestling with a clunky shared workbook or creating a bottleneck where only one person can work at a time.
The Telltale Signs You’ve Outgrown Excel
So, how do you know when the workarounds just aren’t cutting it anymore? There are some pretty clear signals that your projects are getting too big for spreadsheets. These growing pains start small but can quickly bog down your entire team.
- Your team is getting bigger: Juggling tasks for three people on a spreadsheet is one thing. Trying to do it for ten or more turns into a tangled mess of manual updates and “who has the latest version?” emails.
- Your projects are getting complicated: When tasks have intricate dependencies—where one delay dominoes into five others—manually adjusting a Gantt chart becomes a soul-crushing chore.
- You need to collaborate in real-time: If your team needs to see instant updates and communicate directly within the project plan, Excel’s static nature will feel like a massive roadblock.
The real breaking point is when you find yourself spending more time managing the spreadsheet itself than you do managing the actual project. That’s when you know your tool is working against you, not for you.
This isn’t just a hunch; the struggle is real and widespread. While Excel is still king in many offices, its limitations are holding people back. A recent study found that a staggering 92% of workers feel that relying on outdated software like spreadsheets hurts their productivity. Even worse, 57% of them say it negatively impacts their job satisfaction. You can dig into more of these productivity insights on robohead.net.
Ultimately, knowing when to graduate from Excel is a crucial step in scaling your operations. When your projects demand more collaboration, better data integrity, and smarter ways to handle complexity, it’s time to start looking at dedicated software.
Ready to push past the limits of basic spreadsheets? The Analytics Doctor offers expert Excel training and spreadsheet help specifically for HR and finance managers. Visit us to build more powerful, efficient project management systems at https://www.theanalyticsdoctor.com.
Blogs:
Media:
| X | YouTube | TikTok |
Excel for Project Management, Excel for Project Management, Excel for Project Management, Excel for Project Management, Excel for Project Management, Excel for Project Management, Excel for Project Management, Excel for Project Management, Excel for Project Management, Excel for Project Management, Excel for Project Management, Excel for Project Management, Excel for Project Management,
Excel for Project Management, Excel for Project Management, Excel for Project Management, Excel for Project Management, Excel for Project Management, Excel for Project Management, Excel for Project Management, Excel for Project Management, Excel for Project Management, Excel for Project Management, Excel for Project Management, Excel for Project Management, Excel for Project Management, Excel for Project Management, Excel for Project Management,
Excel for Project Management, Excel for Project Management, Excel for Project Management, Excel for Project Management, Excel for Project Management, Excel for Project Management, Excel for Project Management, Excel for Project Management, Excel for Project Management, Excel for Project Management, Excel for Project Management, Excel for Project Management, Excel for Project Management, Excel for Project Management, Excel for Project Management, Excel for Project Management, Excel for Project Management,
Excel for Project Management, Excel for Project Management, Excel for Project Management, Excel for Project Management, Excel for Project Management, Excel for Project Management, Excel for Project Management, Excel for Project Management, Excel for Project Management, Excel for Project Management, Excel for Project Management, Excel for Project Management,