Marketing professionals face an overwhelming flood of data daily, from campaign performance metrics to customer behavior patterns. While sophisticated analytics platforms promise seamless insights, many organizations still rely on Excel as their primary marketing analytics tool. The analytics doctor excel marketing analytics approach combines Excel's flexibility with proven analytical frameworks to transform raw marketing data into actionable intelligence. This comprehensive guide explores how businesses can leverage Excel's powerful features to build robust marketing analytics systems that deliver measurable results without expensive software investments.
Why Excel Remains Essential for Marketing Analytics
Despite the proliferation of specialized marketing analytics platforms, Excel continues to dominate as the preferred tool for analyzing marketing performance. Over 750 million professionals worldwide use Excel, making it the universal language of business analytics. Marketing teams choose Excel because it offers complete control over data manipulation, customization without coding requirements, and seamless integration with virtually any data source.
The analytics doctor excel marketing analytics methodology recognizes Excel's unique position in the marketing technology stack. Unlike black-box platforms that obscure calculation logic, Excel provides full transparency into how metrics are computed. This transparency proves critical when presenting ROI findings to stakeholders who demand verification of analytical methods.
Marketing departments also appreciate Excel's cost-effectiveness. A comprehensive Marketing Analytics Using Excel framework can be implemented without substantial software licensing fees, making sophisticated analytics accessible to organizations of all sizes.
The Evolution of Excel as an Analytics Platform
Excel has transformed from simple spreadsheet software into a comprehensive analytics environment. Recent research on Excel’s evolution as an Integrated Development Environment demonstrates how the platform now supports complex analytical workflows previously requiring specialized programming.
Modern Excel versions include Power Query for data transformation, Power Pivot for data modeling, and advanced statistical functions that rival dedicated analytics tools. These capabilities enable the analytics doctor excel marketing analytics framework to handle datasets with millions of rows and perform sophisticated segmentation analysis.
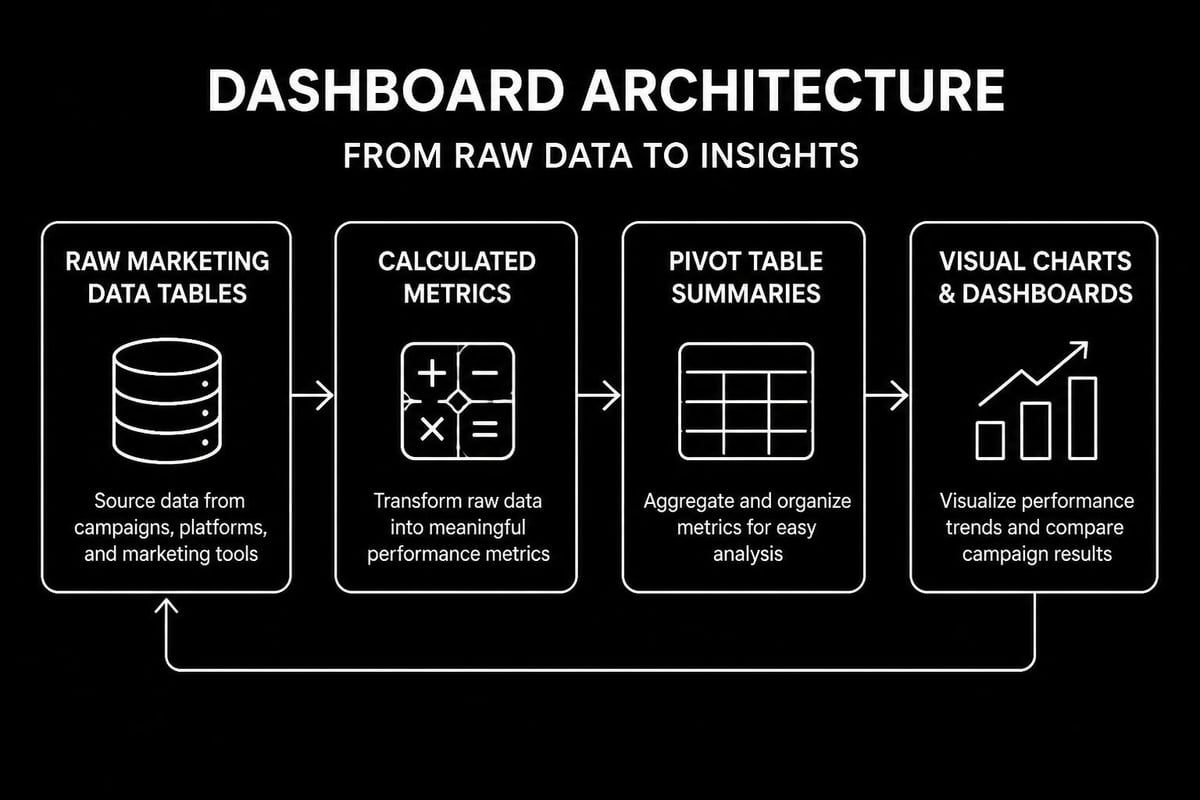
Building Your Marketing Analytics Framework in Excel
Successful marketing analytics begins with proper data architecture. The analytics doctor excel marketing analytics approach emphasizes creating structured, maintainable workbooks that separate raw data, calculations, and presentation layers.
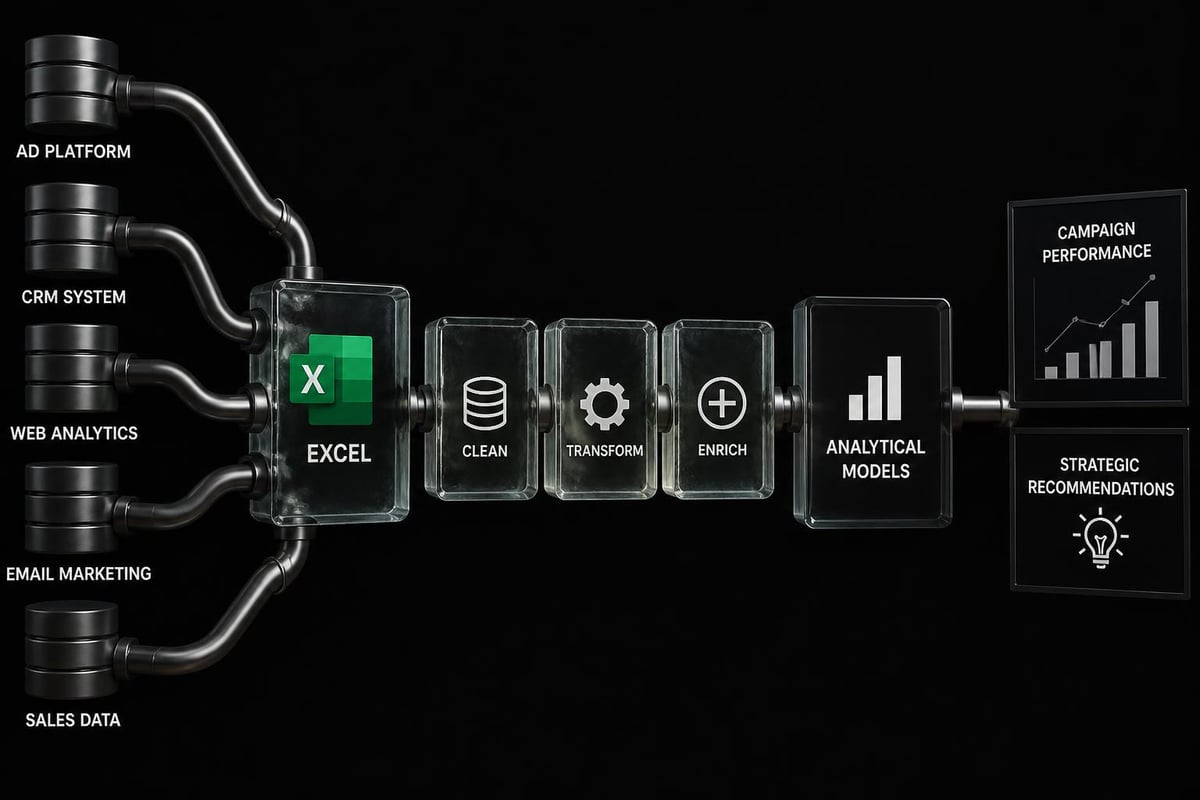
Data Collection and Integration
Marketing data originates from numerous sources:
- Digital advertising platforms (Google Ads, Facebook Ads, LinkedIn)
- Email marketing systems (Mailchimp, HubSpot, Constant Contact)
- Web analytics tools (Google Analytics, Adobe Analytics)
- CRM databases (Salesforce, Microsoft Dynamics)
- E-commerce platforms (Shopify, WooCommerce, Magento)
Power Query serves as the cornerstone for integrating these disparate data sources. This Excel feature automates data extraction, transformation, and loading (ETL) processes, ensuring your analytics remain current without manual copy-pasting.
When building your data integration framework, establish naming conventions for all data sources and create documentation sheets within your workbooks. This practice becomes crucial when creating comprehensive dashboards in Excel that multiple team members will maintain.
Essential Marketing Metrics to Track
The analytics doctor excel marketing analytics methodology focuses on metrics that directly impact business outcomes. Rather than tracking vanity metrics, concentrate on these performance indicators:
| Metric Category | Key Measures | Business Impact |
|---|---|---|
| Acquisition | CAC, CPL, CPC | Cost efficiency |
| Engagement | CTR, Bounce Rate, Time on Site | Content effectiveness |
| Conversion | Conversion Rate, Cart Abandonment | Sales optimization |
| Retention | Churn Rate, LTV, Repeat Purchase Rate | Customer value |
| Revenue | ROAS, Marketing ROI, Revenue Attribution | Profitability |
Building formulas for these metrics requires careful attention to consistency. Marketing teams often struggle with inconsistent date ranges, incomplete data, and attribution challenges. The analytics doctor excel marketing analytics framework addresses these issues through standardized calculation templates and data validation rules.
Advanced Analytical Techniques for Marketing Performance
Beyond basic reporting, Excel enables sophisticated analytical methods that uncover hidden patterns in marketing data. The analytics doctor excel marketing analytics system incorporates several advanced techniques that deliver competitive advantages.
Customer Segmentation and RFM Analysis
Understanding customer segments allows targeted marketing strategies that maximize ROI. RFM (Recency, Frequency, Monetary) analysis segments customers based on purchase behavior, enabling personalized campaign strategies.
Excel's data analysis capabilities make RFM segmentation straightforward:
- Calculate recency scores by measuring days since last purchase
- Compute frequency metrics by counting transactions per customer
- Determine monetary values through total purchase amounts
- Create segmentation matrices using nested IF statements or VLOOKUP
- Assign customer tiers based on combined RFM scores
Detailed tutorials on advanced Excel analytics topics provide step-by-step guidance for implementing RFM and other segmentation frameworks. These techniques transform generic marketing campaigns into precision-targeted initiatives.
Campaign Performance Forecasting
Predictive analytics transforms marketing from reactive to proactive. The analytics doctor excel marketing analytics framework incorporates forecasting methods that predict future campaign performance based on historical patterns.
Excel offers multiple forecasting approaches:
- Linear regression for trend-based predictions
- Moving averages for smoothing seasonal fluctuations
- Exponential smoothing for weighted recent performance
- FORECAST.ETS function for time-series with seasonality
When implementing forecasting models, separate your data into training and testing periods. This validation approach prevents overfitting and ensures your predictions maintain accuracy when applied to new data. Understanding how to calculate moving averages in Excel provides foundation for more sophisticated forecasting techniques.
Creating Interactive Marketing Dashboards
Static reports fail to engage stakeholders or enable data exploration. The analytics doctor excel marketing analytics methodology emphasizes interactive dashboards that allow users to filter, drill down, and discover insights independently.
Dashboard Design Principles
Effective marketing dashboards balance comprehensiveness with clarity. Follow these design standards:
Layout hierarchy positions the most critical metrics prominently, typically in the top-left quadrant where eyes naturally focus first. Secondary metrics and supporting details occupy lower and right-side sections.
Visual consistency maintains uniform color schemes, chart types, and formatting across all dashboard elements. Establish a style guide that defines colors for positive performance (green), negative variance (red), and neutral data (gray or blue).
Interactivity layers incorporate slicers, drop-down lists, and timeline controls that enable dynamic filtering. Users should explore data across different time periods, product categories, or geographic regions without requesting custom reports.
Comprehensive guidance on building professional Excel dashboards demonstrates industry best practices for marketing-specific visualizations and KPI tracking.
Key Dashboard Components
Marketing dashboards typically include these essential elements:
| Component | Purpose | Best Chart Type |
|---|---|---|
| Performance Overview | High-level metric summary | Scorecards with conditional formatting |
| Trend Analysis | Historical performance patterns | Line charts with multiple series |
| Channel Comparison | Cross-channel effectiveness | Clustered column or bar charts |
| Conversion Funnel | Stage-by-stage drop-off | Funnel chart or waterfall chart |
| Geographic Distribution | Regional performance | Map chart or heat map |
| ROI Analysis | Investment versus return | Scatter plot or bubble chart |
The analytics doctor excel marketing analytics framework recommends creating separate dashboard views for different audiences. Executive dashboards emphasize strategic metrics and trends, while tactical dashboards for marketing managers include granular campaign details and optimization opportunities.
Measuring Marketing ROI and Attribution
Return on investment calculation separates successful marketing programs from wasteful spending. However, ROI measurement presents significant challenges in multi-channel environments where customers interact with multiple touchpoints before converting.
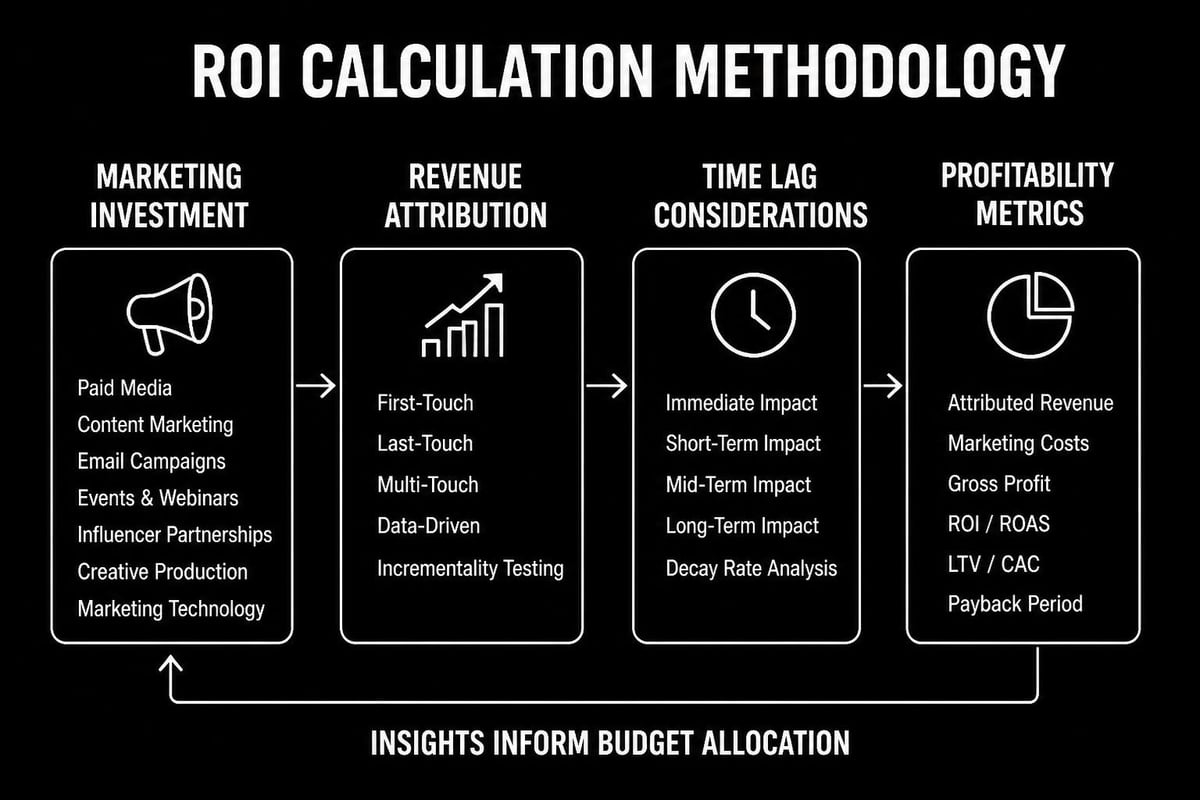
ROI Calculation Frameworks
Basic marketing ROI follows this formula: (Revenue Generated – Marketing Cost) / Marketing Cost × 100. While conceptually simple, accurate implementation requires careful definition of revenue attribution and comprehensive cost tracking.
The analytics doctor excel marketing analytics system implements tiered ROI calculations:
First-touch attribution assigns full credit to the initial marketing interaction. This approach favors awareness channels like display advertising and social media.
Last-touch attribution credits the final interaction before conversion. This methodology emphasizes conversion-focused channels like search advertising and retargeting.
Multi-touch attribution distributes credit across all customer touchpoints. Linear models assign equal weight to each interaction, while time-decay models give more credit to recent touchpoints.
For organizations analyzing marketing analytics methods and practices across departments, establishing standardized ROI frameworks ensures consistent performance evaluation.
Building Attribution Models in Excel
Excel's flexibility enables custom attribution modeling without specialized software. Create attribution models using these steps:
- Compile customer journey data showing all marketing touchpoints
- Define attribution rules based on your business model
- Calculate weighted credit for each channel interaction
- Aggregate attributed revenue by channel and campaign
- Compare attribution models to understand different perspectives
Advanced Excel users leverage Power Pivot to handle the complex joins required for multi-touch attribution analysis. This capability proves essential when analyzing customer journeys spanning months and dozens of interactions.
Automating Marketing Reports and Analysis
Manual report generation consumes valuable time that marketing teams should spend on strategy and optimization. The analytics doctor excel marketing analytics approach emphasizes automation that maintains analytical rigor while reducing repetitive tasks.
Macro Development for Marketing Tasks
VBA macros automate routine marketing analytics workflows. Common automation opportunities include:
- Data refresh sequences that update all external data connections
- Report generation scripts that create formatted reports from templates
- Email distribution systems that send reports to stakeholders automatically
- Data validation routines that identify anomalies or missing information
- Chart updating procedures that adjust visualizations based on new data
Before developing macros, ensure your Excel environment supports macro execution. Learning how to enable macros in Excel provides necessary foundation for implementing automated workflows.
Power Query for Data Transformation
Power Query revolutionizes marketing data preparation by recording transformation steps as reusable queries. Once configured, these queries automatically apply identical transformations to updated source data.
Marketing analysts use Power Query to:
- Combine data from multiple advertising platforms into unified datasets
- Clean inconsistent naming conventions across campaigns
- Calculate derived metrics like cost per acquisition
- Filter out test campaigns or internal traffic
- Reshape data from wide to long format for analysis
The analytics doctor excel marketing analytics methodology treats Power Query as essential infrastructure. Investing time in building robust queries pays dividends through reduced manual data manipulation and improved data quality.
Common Marketing Analytics Challenges and Solutions
Marketing teams encounter predictable obstacles when implementing Excel-based analytics. The analytics doctor excel marketing analytics framework addresses these challenges with proven solutions.
Data Quality and Consistency Issues
Inconsistent data entry, missing values, and formatting variations undermine analytical accuracy. Establish data governance protocols that define:
Standard naming conventions for campaigns, ad groups, and tracking parameters. Implement these conventions in your advertising platforms to ensure consistency at the source.
Required data fields that must be populated for all campaigns. Use Excel's data validation features to prevent incomplete entries.
Date format standards that eliminate confusion between day-first and month-first conventions. Adopt ISO 8601 format (YYYY-MM-DD) for unambiguous date representation.
Managing Large Marketing Datasets
As marketing analytics mature, dataset size often exceeds Excel's comfortable performance range. The analytics doctor excel marketing analytics system employs several strategies for managing large datasets:
Implement data archiving that moves historical data to separate workbooks while maintaining current-period performance in primary analysis files. Create summary tables that aggregate granular data to campaign or daily levels, reducing row counts while preserving analytical value.
For extremely large datasets, consider Power Pivot's in-memory data model, which handles millions of rows more efficiently than standard worksheets. This technology enables sophisticated analysis without migrating to database platforms.
Understanding techniques for reducing Excel file size helps maintain workbook performance as marketing analytics complexity grows.
Integrating Excel with Marketing Technology Platforms
Excel rarely operates in isolation. The analytics doctor excel marketing analytics framework emphasizes seamless integration with the broader marketing technology stack.
API Connections and Data Extraction
Modern marketing platforms offer API access that enables direct data extraction into Excel. Power Query's web connector functionality accesses RESTful APIs, authenticating and retrieving data without manual export procedures.
Establish API connections for:
- Google Ads performance data updated daily with current campaign metrics
- Social media analytics from Facebook, LinkedIn, and Twitter platforms
- Email marketing statistics including open rates, click rates, and conversions
- Web analytics data showing traffic sources and user behavior patterns
LinkedIn Learning offers practical instruction on performing marketing analytics in Excel, including modern integration techniques that connect Excel with digital marketing platforms.
Maintaining Data Security and Compliance
Marketing data often contains personally identifiable information (PII) subject to privacy regulations. The analytics doctor excel marketing analytics methodology incorporates security practices that protect sensitive information:
Use password protection for workbooks containing customer data, but maintain documentation of recovery procedures. Learning how to handle password-protected Excel files prevents data loss when passwords are forgotten.
Implement cell-level protection that locks formula cells while allowing data entry in designated input areas. This approach prevents accidental formula deletion while maintaining worksheet usability.
Scaling Marketing Analytics Capabilities
As organizations recognize the value of data-driven marketing, analytics requirements expand beyond initial implementations. The analytics doctor excel marketing analytics framework provides pathways for scaling analytical capabilities as needs evolve.
Building Analytics Centers of Excellence
Successful marketing analytics programs establish centralized expertise that supports distributed users. Analytics centers of excellence provide:
Template libraries containing pre-built workbooks for common analyses like cohort analysis, funnel optimization, and channel attribution. These templates ensure consistency while accelerating analysis for new team members.
Training programs that develop Excel proficiency across marketing teams. Structured training reduces dependence on individual experts and democratizes analytical capabilities.
Quality assurance processes that validate formulas, audit calculations, and prevent errors in published reports. Implement peer review for critical analyses that inform significant budget decisions.
Organizations pursuing advanced Excel projects benefit from structured capability development that balances immediate needs with long-term skill building.
When to Supplement Excel with Specialized Tools
Excel's versatility doesn't make it ideal for every analytics scenario. The analytics doctor excel marketing analytics approach recognizes situations where supplementary tools deliver superior results:
Real-time visualization requirements often exceed Excel's refresh capabilities. Business intelligence platforms like Tableau or Power BI provide live dashboards that update automatically without manual intervention.
Machine learning applications benefit from Python or R environments with specialized libraries. While Excel supports basic predictive analytics, advanced techniques like neural networks or random forests require dedicated tools.
Collaborative analysis environments may warrant cloud-based platforms that enable simultaneous multi-user editing and version control. Excel's traditional file-based architecture creates challenges for large, distributed teams.
The analytics doctor excel marketing analytics framework treats Excel as the foundation while integrating specialized tools where they provide clear advantages. This pragmatic approach maximizes ROI on analytics investments.
Best Practices for Marketing Analytics Excellence
Implementing the analytics doctor excel marketing analytics methodology requires attention to both technical and organizational factors. These best practices ensure sustainable, scalable analytics programs:
Documentation and Knowledge Transfer
Comprehensive documentation transforms individual expertise into organizational assets. Document these critical elements:
- Data source definitions explaining where each metric originates
- Calculation methodologies detailing formula logic for complex metrics
- Dashboard user guides helping stakeholders interpret visualizations correctly
- Refresh procedures outlining steps for updating data and reports
- Troubleshooting guides addressing common errors and their resolutions
Embed documentation directly within workbooks using comment cells, dedicated instruction sheets, and formula annotations. This embedded approach ensures documentation remains accessible when team members reference analyses.
Continuous Improvement Cycles
Marketing analytics evolve alongside business strategies and market conditions. Establish quarterly review cycles that assess:
- Metric relevance to ensure tracked KPIs align with current business priorities
- Data quality to identify and remediate systematic errors or gaps
- User satisfaction through feedback sessions with report consumers
- Process efficiency to streamline workflows and eliminate bottlenecks
- Technology updates to leverage new Excel features and capabilities
The analytics doctor excel marketing analytics framework treats analytics as living systems requiring regular maintenance and enhancement. This continuous improvement mindset separates high-performing analytics teams from those delivering static, outdated reports.
Error Prevention and Quality Control
Spreadsheet errors in marketing analytics lead to misallocated budgets and strategic missteps. Implement multi-layered quality control:
Formula auditing using Excel's built-in tools to trace precedents, dependents, and identify circular references. Regular audits catch errors before they propagate through dependent calculations.
Reasonableness testing compares calculated metrics against expected ranges. Automated flags highlight impossible values like negative costs or conversion rates exceeding 100%.
Reconciliation procedures validate that detail-level data aggregates correctly to summary totals. Month-end reconciliation catches discrepancies between campaign-level and account-level figures.
Understanding how to compare Excel spreadsheets systematically enables thorough verification of analytical accuracy before distributing reports to stakeholders.
Mastering the analytics doctor excel marketing analytics framework transforms marketing from intuition-based decisions to data-driven strategy, delivering measurable ROI improvements across channels and campaigns. Whether you're struggling with complex formulas, building your first marketing dashboard, or scaling analytics across your organization, expert guidance accelerates your journey to analytical excellence. The Analytics Doctor provides personalized Excel training and support that diagnoses your specific challenges and delivers practical solutions tailored to your marketing analytics needs.