If you have ever wondered how to compare 2 excel spreadsheets in a way that stands up to scrutiny, this guide demonstrates the proven, auditor-grade approach. Whether you are reconciling ledgers, validating procurement lists, or verifying regulatory submissions, comparison is about more than “find and highlight differences.” It is a controlled process that documents scope, tests assumptions, isolates variance drivers, and produces reproducible evidence. In regulated industries and high-stakes finance, that distinction is decisive for confidence, compliance, and speed.
At The Analytics Doctor, we see the same root problems repeatedly: staff lack deep Excel skills, workflows rely on manual steps, and critical spreadsheets are fragile or poorly designed. That is why we combine training and automation so your team compares accurately the first time and builds repeatable processes thereafter. You will learn structured ways to deploy formulas, Power Query, and Visual Basic for Applications (VBA) in Microsoft Excel, plus when specialized tools make sense. Along the way, you will find template guidance, checkpoints, and examples you can adapt immediately to your environment.
How to Compare 2 Excel Spreadsheets: Auditor-Grade Workflow
Auditors do not start by pressing a Compare button; they define objectives, control for data quality, and document every decision. Begin by clarifying the business question and the acceptable tolerance. Are you verifying perfect equality, reconciling many-to-one mappings, or detecting drift over several periods? Next, lock down the data lineage. Capture file names, versions, author, refresh dates, and data sources so the comparison can be reproduced later and independently reviewed if needed.
Then, establish a reliable join key or composite key. For example, use CustomerID + Period or ItemCode + PriceListDate. Standardize the schema by trimming whitespace, normalizing case, converting numbers stored as text, and validating date formats. A brief profiling pass will cut your rework time in half. Only after this setup should you choose tactics: direct formulas for lightweight cases, Power Query for robust joins and repeatability, or Visual Basic for Applications (VBA) macros for large-scale cell-by-cell scans. Each method can be supported with clear logs and variance reports that non-technical stakeholders can read.
- Define scope and tolerance: what fields matter and what variance is acceptable.
- Collect lineage: file paths, versions, authors, and refresh timestamps.
- Profile the data: row counts, duplicate keys, blank rates, data types.
- Create or confirm keys: single key or composite keys as needed.
- Standardize: trim, case-normalize, fix types, and align headers.
- Pick a method: formulas, Power Query, workbook comparison utility, or macro.
- Generate evidence: logs, annotated tabs, and saved comparison outputs.
- Review and remediate: fix sources, then rerun to confirm clean results.
Formula-Driven Precision: XLOOKUP, EXACT, COUNTIFS, and Smart Flags
Formulas are ideal when your files share a stable key and only several columns must be checked. For an item-by-item reconciliation, place both tables in a single workbook on separate sheets named Old and New. Create a Results sheet with a unique list of keys, then bring in comparable fields via XLOOKUP. Where backward compatibility is required, use VLOOKUP (vertical lookup). To remove ambiguity, wrap comparisons in EXACT so case differences are detected explicitly, and add IFERROR to make missing matches clear rather than silently blank.
Watch This Helpful Video
To help you better understand how to compare 2 excel spreadsheets, we’ve included this informative video from Chester Tugwell. It provides valuable insights and visual demonstrations that complement the written content.
Below is a compact pattern that scales from prices to status codes. It flags three things: unmatched keys, changed values, and changed formulas if you are auditing within one workbook. You will also see a simple tolerance option for numeric ranges, useful in currency conversions or rounding. As a best practice, document each flag with a brief label rather than raw TRUE or FALSE values so non-technical reviewers grasp your result without reading the formulas themselves.
' Results!A2 downward: unique keys
=UNIQUE(Old!A2:A100000)

' Results!B2: fetch Old price
=XLOOKUP(A2, Old!A:A, Old!B:B, "Missing in Old")

' Results!C2: fetch New price
=XLOOKUP(A2, New!A:A, New!B:B, "Missing in New")

' Results!D2: numeric variance
=IF(OR(ISNUMBER(B2), ISNUMBER(C2)), C2 - B2, NA())

' Results!E2: variance flag with tolerance (example 0.01)
=IF(OR(B2="Missing in Old", C2="Missing in New"), "Missing Key", IF(ABS(D2)>0.01, "Changed", "Same"))

' Case-sensitive text compare
=IF(AND(B2<>"Missing in Old", C2<>"Missing in New"), IF(EXACT(B2, C2), "Same-Text", "Changed-Text"), "Missing Key")

' One-to-many duplicate detection
=IF(COUNTIFS(Old!A:A, A2)>1, "Duplicate in Old", IF(COUNTIFS(New!A:A, A2)>1, "Duplicate in New", "Unique"))
| Scenario | Recommended Formula | Why It Works | Risk to Control |
|---|---|---|---|
| Case-sensitive text checks | EXACT(old, new) | Distinguishes ABC vs Abc | Hidden case changes |
| Price or quantity drift | ABS(new – old) > tolerance | Flags material changes only | Noise from rounding |
| Missing records | IFERROR(XLOOKUP(…), “Missing”) | Makes gaps explicit | Silent blanks |
| Duplicate keys | COUNTIFS(key, value) > 1 | Prevents false matches | One-to-many joins |
Conditional Formatting, Go To Special, and Side-by-Side Review
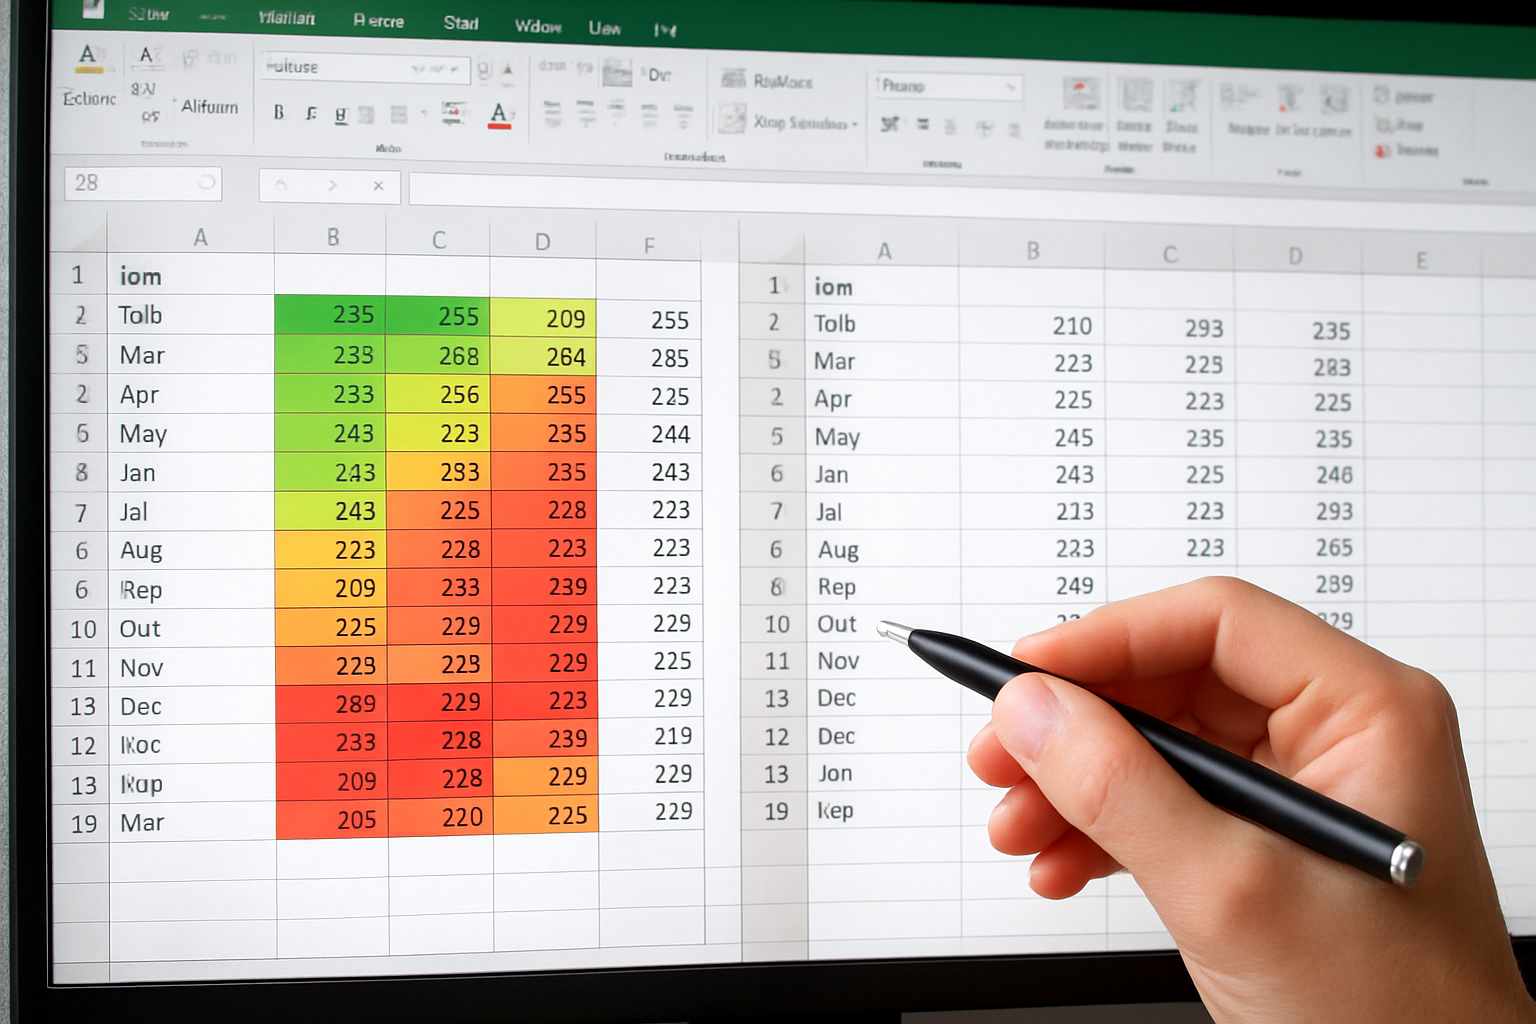
Visual inspection is faster when a stakeholder needs a quick read before deep analysis. Conditional Formatting can highlight cell-by-cell differences in aligned tables, while Go To Special pinpoints constants, formulas, or errors. Align both datasets into the same sheet so rows and columns correspond, then use a helper range to compare relative cells. For an executive review, “View Side by Side” synchronizes scrolling across two windows, allowing you to narrate differences in a live session and capture decisions immediately.
- Place Old table in columns A to D and New table in columns F to I with identical headers.
- In a helper block, compare A2 to F2, B2 to G2, and so on using =A2=F2 to return TRUE or FALSE.
- Apply Conditional Formatting where helper cells equal FALSE to shade only mismatches.
- Use Go To Special to select only constants or only formulas in the helper block to isolate types of mismatches.
- Open a new window for the workbook, arrange vertically, and enable View Side by Side with synchronous scrolling.
- Freeze panes for headers, apply Filters, and save filtered views that reflect agreed exceptions or tolerance rules.
- Tip: Normalize before you color. Trim spaces, unify date formats, and convert numbers stored as text to actual numbers to prevent false positives.
- Tip: Save the conditional format rules together with a legend tab so reviewers understand your color codes at a glance.
Power Query and Workbook Comparison Utilities: Industrial-Strength Options
Power Query is Excel’s Extract, Transform, Load (ETL) engine and is excellent for repeatable comparisons. Load both tables from sheets, Comma Separated Values (CSV) files, or databases via connectors, apply type conversion, and Merge on a chosen key. Add a custom column to compute differences, then output a tidy exceptions table that refreshes with one click. Because each step is recorded, your audit trail is transparent. For multi-source reconciliations or when joins are complex, this approach is faster and less error-prone than nested formulas.
- Data tab, Get Data, From Workbook or From Text/CSV, load Old and New as queries.
- Power Query Editor, select key column(s), choose Merge Queries, and pick a join type (Inner for matches, Full Outer for all records).
- Expand columns from each side, rename systematically with prefixes Old_ and New_.
- Add custom columns for variances, for example, [New_Price] – [Old_Price], and set a tolerance rule.
- Filter to exceptions, load to a new sheet, and refresh as inputs change.
Some Excel installations include a workbook comparison utility (available via the Inquire add-in in certain Microsoft 365 plans) that performs workbook-to-workbook comparisons including formulas, values, and Visual Basic for Applications (VBA) code. When available, such utilities can produce a structural comparison that reports changed formulas, constants, named ranges, and shapes. This is particularly useful during model governance, where every change between approved versions must be justified. Results can be exported, attached to change requests, and retained for compliance reviews.
- If a workbook comparison utility is available in your environment, consult your IT team or Microsoft documentation for enabling and running it, and archive the generated reports with your sign-off package.
| Method | When to Use | Strengths | Limitations | Skill Level |
|---|---|---|---|---|
| Formulas | Small to medium, stable schema | Transparent, easy to audit | Fragile with schema changes | Intermediate |
| Conditional Formatting | Quick visual scan of aligned tables | Immediate insight | Not robust across schema drifts | Beginner |
| Power Query | Repeatable pipelines and joins | Strong ETL and refreshable logic | Initial setup time | Intermediate to Advanced |
| Workbook comparison utilities | Version control and model governance | Structural diffs including VBA | Not designed for complex joins | Intermediate |
| Third-party diff tools | Cross-format comparisons or CLI automation | Fast, some have API and GUI | Licensing and integration effort | Intermediate |
Automate at Scale with a VBA Macro: Cell-by-Cell, With Evidence
When two similarly shaped sheets must be compared cell by cell, a well-structured macro is efficient and auditable. The macro below scans the used range on two worksheets, flags value and formula differences, writes a log, and shades cells so reviewers can navigate immediately. It also handles sheet size mismatches gracefully. In environments where change control is strict, save the macro-enabled workbook in source control and attach the run log to your ticket. This is a practical way to embed Visual Basic for Applications (VBA) into a governed workflow without increasing operational risk.
Option Explicit

Sub CompareSheets()
    Dim wsA As Worksheet, wsB As Worksheet, wsOut As Worksheet
    Dim rA As Range, rB As Range
    Dim maxRows As Long, maxCols As Long
    Dim r As Long, c As Long, outRow As Long
    Dim vA As Variant, vB As Variant

    Set wsA = ThisWorkbook.Worksheets("Old")
    Set wsB = ThisWorkbook.Worksheets("New")
    On Error Resume Next
    Set wsOut = ThisWorkbook.Worksheets("Comparison_Log")
    On Error GoTo 0
    If wsOut Is Nothing Then
        Set wsOut = ThisWorkbook.Worksheets.Add
        wsOut.Name = "Comparison_Log"
    Else
        wsOut.Cells.Clear
    End If

    wsOut.Range("A1:E1").Value = Array("Row", "Column", "Type", "Old", "New")
    outRow = 2

    Set rA = wsA.UsedRange
    Set rB = wsB.UsedRange
    maxRows = Application.WorksheetFunction.Max(rA.Rows.Count, rB.Rows.Count)
    maxCols = Application.WorksheetFunction.Max(rA.Columns.Count, rB.Columns.Count)

    For r = 1 To maxRows
        For c = 1 To maxCols
            vA = GetCellValueOrBlank(wsA, r, c)
            vB = GetCellValueOrBlank(wsB, r, c)

            If IsError(vA) And Not IsError(vB) Then
                LogDiff wsOut, outRow, r, c, "Error to Value", CStr(vA), CStr(vB)
                Shade wsB.Cells(r, c), RGB(255, 235, 156)
            ElseIf Not IsError(vA) And IsError(vB) Then
                LogDiff wsOut, outRow, r, c, "Value to Error", CStr(vA), CStr(vB)
                Shade wsB.Cells(r, c), RGB(255, 199, 206)
            ElseIf vA <> vB Then
                LogDiff wsOut, outRow, r, c, "Value Change", CStr(vA), CStr(vB)
                Shade wsB.Cells(r, c), RGB(198, 239, 206)
            End If

            ' Check formulas when both cells have formulas
            If HasFormula(wsA, r, c) Or HasFormula(wsB, r, c) Then
                If wsA.Cells(r, c).FormulaLocal <> wsB.Cells(r, c).FormulaLocal Then
                    LogDiff wsOut, outRow, r, c, "Formula Change", wsA.Cells(r, c).FormulaLocal, wsB.Cells(r, c).FormulaLocal
                    Shade wsB.Cells(r, c), RGB(180, 198, 231)
                End If
            End If
        Next c
    Next r

    wsOut.Columns.AutoFit
    MsgBox "Comparison complete. See 'Comparison_Log' for details.", vbInformation
End Sub

Private Function GetCellValueOrBlank(ws As Worksheet, r As Long, c As Long) As Variant
    If r <= ws.Rows.Count And c <= ws.Columns.Count Then
        GetCellValueOrBlank = IIf(ws.Cells(r, c).Value = "", "", ws.Cells(r, c).Value)
    Else
        GetCellValueOrBlank = ""
    End If
End Function

Private Function HasFormula(ws As Worksheet, r As Long, c As Long) As Boolean
    On Error Resume Next
    HasFormula = ws.Cells(r, c).HasFormula
    On Error GoTo 0
End Function

Private Sub LogDiff(ws As Worksheet, ByRef outRow As Long, r As Long, c As Long, t As String, oldV As String, newV As String)
    ws.Cells(outRow, 1).Value = r
    ws.Cells(outRow, 2).Value = c
    ws.Cells(outRow, 3).Value = t
    ws.Cells(outRow, 4).Value = oldV
    ws.Cells(outRow, 5).Value = newV
    outRow = outRow + 1
End Sub

Private Sub Shade(target As Range, clr As Long)
    With target.Interior
        .Pattern = xlSolid
        .Color = clr
    End With
End Sub
- Usage note: Place comparable sheets with the same starting cell and headers. Rename to Old and New or adjust the code. Save as a macro-enabled file and sign if required by Information Technology (IT) policy.
- Evidence: The Comparison_Log sheet serves as your audit log. Export it to Comma Separated Values (CSV) and archive alongside your approval ticket.
Tooling, Risk Controls, and Real-World Results

Choosing the right tool is not merely a technical decision; it is a control decision. If a procurement price file changes weekly, a Power Query merge with a refreshable exceptions table avoids spreadsheet drift and cuts recurring labor. For quarterly model governance, workbook comparison utilities can produce an authoritative record of formula and code changes, including Visual Basic for Applications (VBA) modules. In one banking client, standardizing on Power Query reduced a four-hour reconciliation to ten minutes and eliminated manual rekeying entirely. Across finance and operations, that scale of improvement compounds, delivering measurable Return on Investment (ROI) within a quarter.
Below is a concise matrix to guide selection. Consider audience, frequency, data volume, and the need for governance artifacts. The Analytics Doctor helps teams formalize these decisions into standard operating procedures with clear roles, thresholds, and handoffs. Beyond selection, we harden your templates, add input validation, and embed documentation into the workbook so reviewers see what changed, why it changed, and who approved it. That is how organizations graduate from ad hoc fire drills to reliable, repeatable spreadsheet comparisons that withstand regulatory and executive scrutiny.
| Use Case | Preferred Method | Volume | Governance Output | Automation |
|---|---|---|---|---|
| Price list changes week to week | Power Query Merge | Up to 1M rows | Refreshable exceptions report | Scheduled refresh |
| Quarterly model version diffs | Workbook comparison utility | Workbook scale | Change report including formulas and code | Manual run with sign-off |
| Ad hoc, two aligned tables | Formulas + Conditional Formatting | Small to medium | Inline flags on Results sheet | Manual or light macro |
| Cross-format data sources | Power Query or third-party tool | Large | Scripted steps and logs | Command Line Interface (CLI) or scheduled job |
Real-world examples demonstrate impact. A retail operations team detected vendor catalog drift affecting 2 percent of SKUs, preventing margin erosion projected at six figures annually. A government agency validated two Extract, Transform, Load (ETL) outputs against the same Structured Query Language (SQL) source and found a silent text-to-number conversion that miscounted cases by 1.3 percent. An enterprise resource planning (ERP) cutover team reconciled legacy and new item masters in hours instead of weeks by using Power Query merges combined with targeted formulas for edge cases. The common thread is a disciplined workflow that balances speed with documented evidence.
Common Pitfalls and an Auditor’s Checklist
Most comparison failures are not algorithmic; they are caused by avoidable data hygiene issues and undocumented assumptions. Numbers stored as text, invisible trailing spaces, and locale-specific dates are the usual culprits. Likewise, missing or unstable keys lead to false matches or unexplainable gaps. It is pragmatic to assume your first pass will surface data quality problems, then iterate: fix at the source where possible, annotate the exception when not, and keep the thresholds visible on the page. Consistency beats cleverness in audit scenarios.
| Problem | Symptom | Detection | Remediation |
|---|---|---|---|
| Numbers stored as text | Equality checks fail | ISTEXT or green corner indicator | Value(), Text to Columns, or Power Query type conversion |
| Trailing spaces | Keys do not match | LEN, TRIM checks | TRIM/CLEAN or Power Query Trim |
| Inconsistent dates | Mis-sorted or mismatched | ISNUMBER on dates | DATEVALUE, locale-aware parsing |
| Duplicate keys | Double counts or joins explode | COUNTIFS on keys | Deduplicate or define many-to-one rules |
- Define keys and tolerance in writing.
- Record data lineage and refresh timestamps.
- Normalize types and text before comparing.
- Use a consistent flag legend and log outputs.
- Archive evidence with approvals and rerun steps as needed.
Where The Analytics Doctor Fits: Training, Templates, and Support
Your team can implement everything in this guide, but many organizations benefit from acceleration. The Analytics Doctor delivers tailored corporate Excel training in flexible 1–5 day courses aligned to your workflows, from introductory fundamentals to advanced reconciliation and automation. We build custom automated templates and comparison dashboards, harden fragile spreadsheets, and add safeguards such as input validation, documentation panels, and automated evidence logs. Rapid turnaround, precision-focused processing, and ongoing expert support mean you move from firefighting to calm, reliable execution.
Consider how this changes daily operations. Financial planning and analysis teams reconcile budget versions hourly without manual copy-paste. Risk management logs each model change with workbook comparison outputs (where available) and Visual Basic for Applications (VBA) evidence attached. Operations leaders review exception-only reports rather than raw dumps. The business outcome is consistent: fewer errors, faster cycles, and more time for analysis. If your mandate this year includes building audit-ready processes and training that sticks, we are ready to help you operationalize how to compare 2 excel spreadsheets in a repeatable, defensible way.
Final thought. The fastest path to value blends pragmatic tactics with strong controls. By combining clean inputs, fit-for-purpose tools, and transparent evidence, your comparisons become trustworthy and fast. Imagine a world where reconciliations refresh on command, exceptions are self-explanatory, and audits are passed without drama. In the next 12 months, which comparison will you transform first, and what would it unlock for your team?
Additional Resources
Explore these authoritative resources to dive deeper into how to compare 2 excel spreadsheets.
Audit-Ready Excel Comparisons with The Analytics Doctor
For corporations, banks, government agencies, and Excel-reliant teams, The Analytics Doctor delivers tailored 1–5 day Excel training to build skills, automate comparisons, reduce errors, meet deadlines, and improve margins.