The workplace is evolving fast, and in 2025, advanced Excel projects are becoming essential for anyone looking to thrive in data-driven roles. Employers seek professionals who can go beyond the basics, tackling automation, analytics, and dynamic data visualization head-on.
This article spotlights eight advanced Excel projects designed to challenge your skills and boost your career prospects. By working through these real-world projects, you’ll master techniques that matter most—like Power Query, VBA, and dashboard creation.
Ready to level up? Dive in and discover how these hands-on projects can unlock your potential and set you apart.
Why Advanced Excel Projects Matter in 2025
The workplace of 2025 is more data-driven than ever. As businesses embrace automation and handle ever-larger data sets, Excel’s role continues to evolve from simple spreadsheets to robust platforms for analysis, automation, and decision-making. Advanced excel projects are no longer just a “nice to have”—they’re becoming essential for professionals in finance, analytics, operations, and beyond.
Unlike passive tutorials, project-based learning accelerates mastery of complex functions and tools. By building advanced excel projects, you’re not just memorizing formulas; you’re applying them to real-world challenges. This hands-on experience helps cement knowledge, foster creativity, and develop troubleshooting skills that employers value.
What skills are employers seeking in 2025? According to recent job postings, the most in-demand Excel abilities include:
| Skill | Why It Matters |
|---|---|
| Power Query | Automates data import/cleanup |
| Advanced Formulas | Drives custom analysis |
| VBA Macros | Enables process automation |
| Dashboarding | Visualizes data for decision-making |
| Integration | Connects Excel with other tools |
Industries prioritizing these advanced excel projects include:
- Financial services (for dynamic reporting and modeling)
- Retail and e-commerce (for forecasting and inventory)
- Healthcare (for analytics and compliance)
- Consulting and business analysis
The demand is real. LinkedIn and Indeed show a steady rise in postings requiring advanced excel projects skills. In fact, a recent study revealed that Excel power users are 30% more likely to be shortlisted for analyst and management roles. For more details on exactly which skills employers are targeting, check out Excel Skills Employers Seek in 2025.
Why does this matter for your career? Completing advanced excel projects builds a portfolio that stands out to employers. It demonstrates problem-solving, critical thinking, and the ability to deliver real results. Many professionals have leveraged their project portfolios to land promotions, transition into analytics roles, or launch successful freelance businesses.
In summary, advanced excel projects are your gateway to mastering today’s most sought-after skills. They don’t just teach you how to use Excel—they show you how to create solutions, drive value, and future-proof your career in a rapidly changing job market.

8 Advanced Excel Projects to Boost Your Skills in 2025
Ready to take your spreadsheet expertise to the next level? Dive into these 8 advanced excel projects designed for 2025’s fast-paced, data-driven world. Each project blends technical depth with real-world application, ensuring you not only build practical skills but also stand out in competitive job markets.

1. Dynamic Financial Dashboard
A dynamic financial dashboard is a must-have in any list of advanced excel projects. It lets you visualize key financial metrics and make data-driven decisions in real time.
Start by gathering financial data from various sources. Use Power Query to automate imports and keep your dashboard updated. Employ PivotTables and slicers for instant data filtering. Dynamic charts provide quick insights into trends, while conditional formatting highlights critical variances or performance alerts.
Advanced formulas like INDEX/MATCH and SUMPRODUCT allow you to calculate custom KPIs, such as operating margins or budget variances. For example, you might track monthly profit and loss, cash flow, and compare budgets versus actuals, all in one interactive interface.
To make your dashboard visually compelling:
- Choose a clean layout and consistent color scheme.
- Add interactive buttons for filtering.
- Use sparklines for trend snapshots.
Financial professionals and business analysts rely on these dashboards for quick, accurate reporting. For more techniques on building dashboards, check out Excel Dashboard Techniques. Mastering this project will sharpen your analytical edge.
2. Automated Inventory Management System
Managing stock efficiently is a classic challenge addressed by advanced excel projects. An automated inventory system helps you track stock levels, reorder points, and supplier details with minimal manual effort.
Begin by designing tables for products, suppliers, and transactions. Use data validation and drop-down lists for error-free entries. VBA macros can automate stock updates and generate reorder alerts when inventory dips below thresholds. For tech-savvy users, integrating barcode scanning further streamlines input.
Summarize inventory status with PivotTables and charts, giving you a clear view of stock movement and trends. For example, a small business managing multiple SKUs can instantly see which items need reordering and which suppliers to contact.
Scalability is crucial. As your business grows, this system can be integrated with accounting software or e-commerce platforms. Automation not only saves time but also ensures inventory accuracy, reducing costly errors.
3. Sales Forecasting Model with Power Query
Sales forecasting is a cornerstone of advanced excel projects, empowering businesses to plan ahead. Start by importing large datasets—historical sales, promotions, and market trends—using Power Query for efficient data cleaning.
Apply time-series analysis with formulas like FORECAST and TREND. Use scenario analysis and what-if tools to predict outcomes under different market conditions. Visualize trends with dynamic line and area charts, making it easy to spot seasonal fluctuations.
For example, a retail chain can forecast holiday sales, adjust inventory, and plan marketing campaigns accordingly. Handling outliers and missing data is crucial; Power Query offers robust tools for this.
Retail and e-commerce sectors especially benefit from accurate sales projections, impacting everything from procurement to staffing. This project hones your skills in data modeling and predictive analytics.
4. Project Management Tracker with Gantt Charts
Staying organized is vital, and project management trackers are popular advanced excel projects for teams of all sizes. Build a tracker with columns for tasks, deadlines, dependencies, and status.
Automate Gantt charts using formulas and conditional formatting. Visual indicators—such as color-coded progress bars—make tracking easy at a glance. Data validation ensures accurate task assignments and priorities.
Suppose you’re managing a marketing campaign with multiple deliverables. With this tracker, you can visualize timelines, allocate resources, and monitor progress. Sharing options and collaboration features make it suitable for teams.
Scaling to larger projects is straightforward: add more columns for resources or integrate with cloud tools. Project managers and team leads can streamline workflows and boost productivity with this approach.
5. Customer Relationship Management (CRM) Dashboard
Advanced excel projects often include custom CRM dashboards, enabling freelancers and small businesses to manage leads, contacts, and sales pipelines efficiently.
Build a CRM tool with tables for client information, deal stages, and follow-up schedules. Use advanced lookup functions like XLOOKUP and FILTER for instant contact retrieval. Automate follow-up reminders with VBA or formulas to ensure no lead is missed.
Visualize your sales pipeline with charts, tracking conversion rates and bottlenecks. For example, freelancers can monitor client interactions, while small businesses can optimize their sales process.
Pay attention to data privacy—use password protection and limit access where necessary. Integrate with email or calendar tools for seamless workflow. A custom CRM not only saves software costs but also gives you a competitive edge with tailored analytics.
6. Data Cleaning and Transformation Tool
Clean data is the foundation of reliable analysis, making this one of the most practical advanced excel projects. Develop a reusable template for cleaning and transforming messy datasets.
Power Query helps with deduplication, splitting columns, and changing data types. Advanced formulas detect and correct errors—think of using IFERROR, ISNUMBER, or custom logic. Automate repetitive cleaning steps with VBA scripts to save time.
For instance, preparing survey data for analysis often involves removing duplicates, standardizing formats, and handling missing values. Document your cleaning steps for transparency and make workflows shareable for team use.
Common data issues—like inconsistent date formats or typos—can be solved efficiently with this tool. Clean data ensures your reports and analyses are accurate and trustworthy.
7. Stock Market Portfolio Tracker
Investment enthusiasts and finance professionals often turn to advanced excel projects like stock market portfolio trackers. These tools pull real-time stock prices using web queries or APIs, keeping your portfolio up to date.
Calculate performance metrics such as returns, volatility, and diversification. Data visualization—pie charts for asset allocation, line charts for performance—provides instant insights. Automate alerts for price thresholds or relevant news.
For example, an individual investor managing a diverse portfolio can monitor holdings, rebalance assets, and set up custom alerts. Integrating financial news feeds offers even more context for decision-making.
Customizing the tracker for different investment strategies deepens your understanding of risk and return. This project is a hands-on way to learn market analysis and automation techniques.
8. HR Analytics Dashboard
HR teams need data-driven insights, and HR analytics dashboards are standout advanced excel projects for tracking workforce metrics. Build dashboards that analyze turnover, absenteeism, diversity, and engagement.
Use PivotTables and advanced charts to break down demographics. Automate data refreshes with Power Query, ensuring up-to-date analytics. Conditional formatting highlights key HR indicators, such as high turnover or gaps in diversity.
For example, tracking Diversity, Equity, and Inclusion (DEI) progress helps organizations align with strategic goals. Anonymize sensitive data to protect employee privacy. Reference industry benchmarks to compare performance.
HR analytics dashboards support better decision-making and showcase your ability to turn raw data into actionable insights.
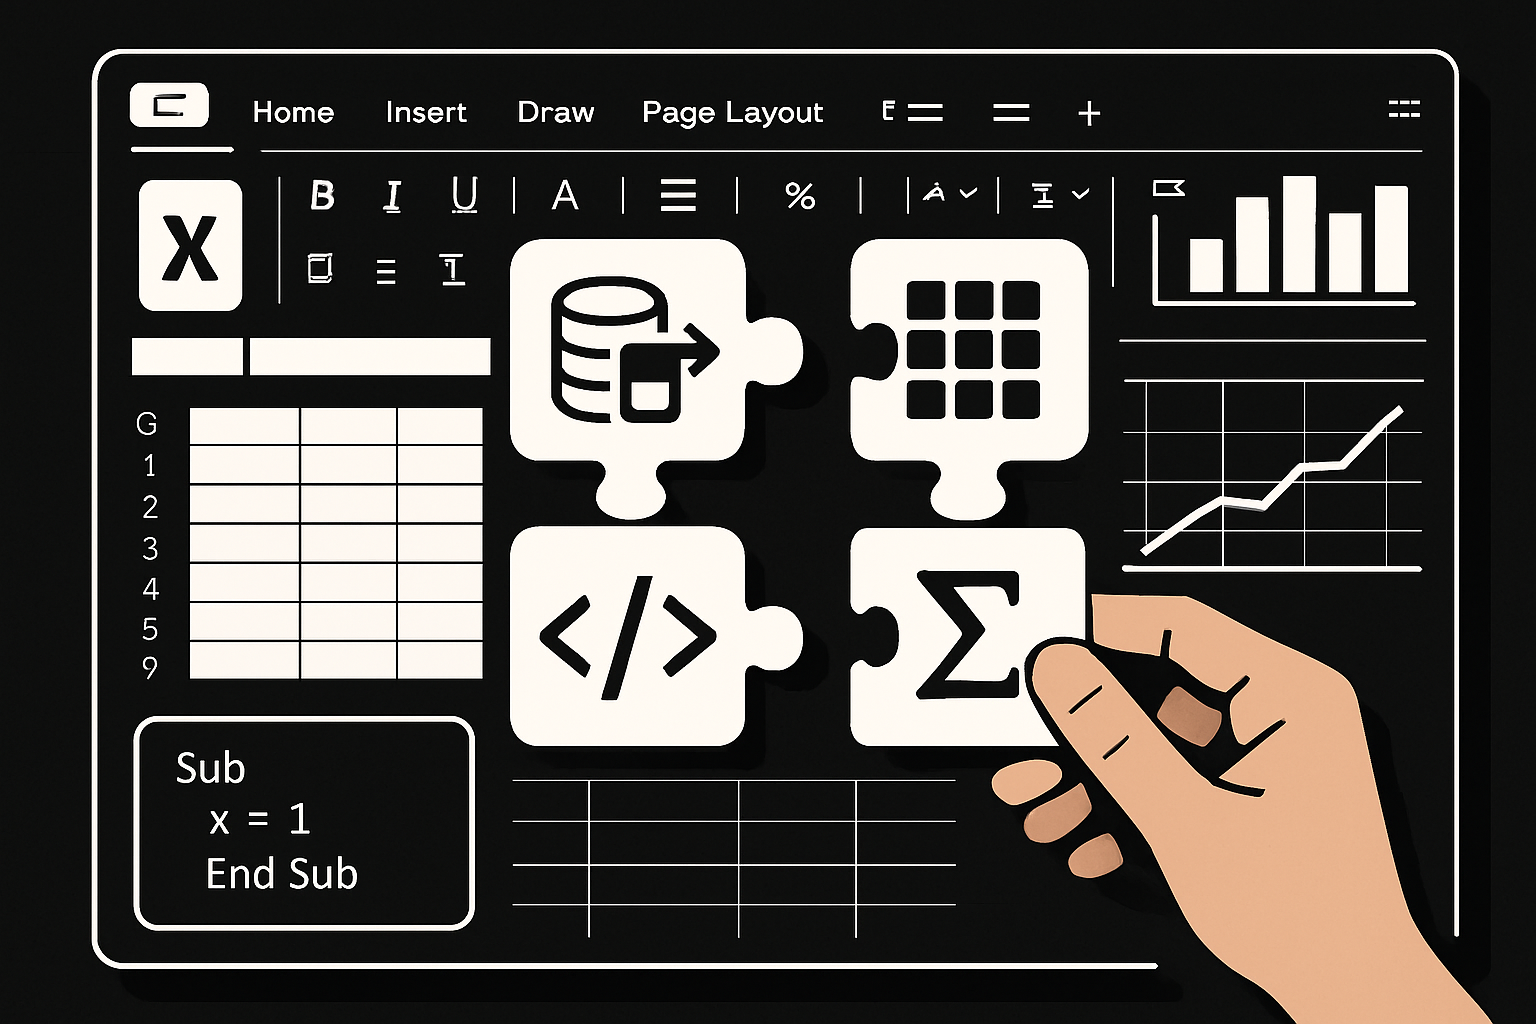
Essential Tools and Functions for Advanced Excel Projects
Mastering the right tools is the backbone of successful advanced excel projects. In 2025, the sheer variety of features within Excel can feel overwhelming, but focusing on a few essential functions will elevate your efficiency and creativity. Whether you’re automating workflows or building dynamic dashboards, knowing which tools to reach for will make all the difference.
Core Tools and Functions for Advanced Excel Projects
To tackle advanced excel projects, you’ll need to get comfortable with a few powerhouse features:
- Power Query: Seamlessly imports, cleans, and transforms data from countless sources.
- PivotTables: Summarize, analyze, and visualize data with just a few clicks.
- Advanced Formulas: Leverage XLOOKUP, SUMPRODUCT, and array formulas for custom calculations.
- VBA (Visual Basic for Applications): Automate repetitive tasks and build custom solutions.
Each of these tools brings unique strengths. For example, Power Query handles messy data, while PivotTables turn raw numbers into actionable insights. Advanced formulas allow for deep analysis, and VBA unlocks automation at scale.
Combining Tools for Maximum Impact
The real magic of advanced excel projects comes from blending these tools. Imagine using Power Query to import sales data, PivotTables to break down performance by region, and advanced formulas to flag anomalies. Add a VBA script to automate monthly updates, and suddenly you have a self-sustaining reporting system.
Automation is a game-changer. With Automated Excel Spreadsheet Solutions, you can explore strategies for integrating VBA and Power Query, streamlining everything from inventory management to financial reporting. This approach not only saves time but also minimizes errors and boosts productivity.
Evolving Features, Troubleshooting, and Resources
Excel continues to evolve. In 2025, new features like dynamic arrays and enhanced data connectors expand what’s possible in advanced excel projects. Staying updated ensures you’re leveraging every advantage.
Even the best-built projects run into issues. Common trouble spots include formula errors, slow workbooks, or data refresh failures. Tackle these by breaking problems into smaller parts, using Excel’s built-in auditing tools, and seeking advice from community forums.
Continuous learning is key. Platforms like Advanced Excel Training offer structured paths to deepen your skills and keep pace with Excel’s rapid evolution.
Continuous Learning for Advanced Excel Mastery
The landscape of advanced excel projects is always shifting. Embrace curiosity, experiment with new tools, and document your solutions. Building a habit of learning and seeking out expert resources will keep your skills sharp and your projects impactful.
With the right toolkit and mindset, you’ll be ready to take on any Excel challenge that comes your way in 2025.
Excel Training and Support from The Analytics Doctor
Ready to master advanced excel projects and take your skills to a professional level? The Analytics Doctor is your trusted partner for real-world Excel expertise.

Choose from:
- Tailored training programs for individuals and teams—virtual or in-person.
- Custom spreadsheet solutions for unique business challenges.
- Hands-on support to troubleshoot and optimize your advanced excel projects at every stage.
Whether you're building dashboards, automating workflows, or seeking Excel for Project Management solutions, expert guidance accelerates your results. Clients worldwide have leveraged this support for proven, career-boosting success.
Reach out today for personalized help or advanced Excel training designed to propel your project success.