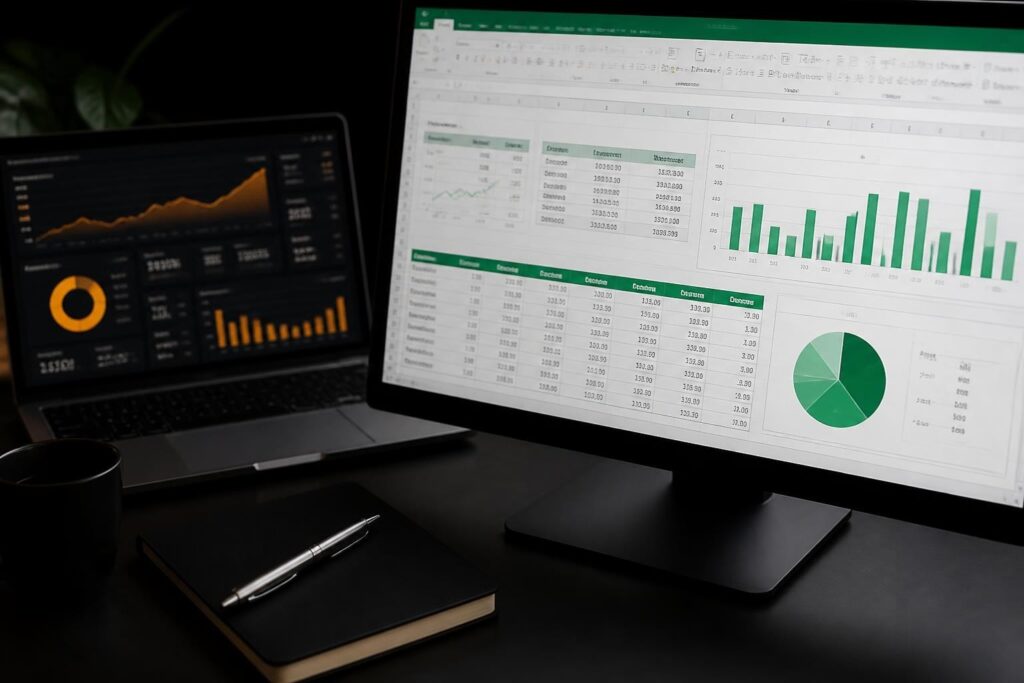
When businesses need to extract meaningful insights from their website traffic data, web analytics consulting excel emerges as a powerful combination that delivers results without requiring expensive enterprise software. Excel's robust analytical capabilities, when paired with strategic consulting expertise, transform raw web metrics into actionable business intelligence. Organizations across industries are discovering that spreadsheet-based analytics offers flexibility, customization, and depth that rivals specialized platforms while remaining accessible to teams of all technical levels.
Understanding the Web Analytics Consulting Excel Approach
Web analytics consulting excel represents the intersection of digital marketing measurement and spreadsheet mastery. This approach leverages Excel's computational power to process website data, customer behavior metrics, and conversion statistics into formats that drive strategic decisions.
The modern business landscape generates enormous volumes of web data daily. Traffic sources, bounce rates, session durations, conversion paths, and user demographics all require systematic analysis. While platforms like Google Analytics provide dashboards, the real value emerges when consultants extract this data into Excel for deeper exploration and custom reporting frameworks.
Why Excel Remains Central to Analytics Consulting
Several factors make Excel indispensable for web analytics consulting work:
- Universal accessibility across organizations without specialized software requirements
- Customization capabilities that allow tailored analysis frameworks for unique business needs
- Advanced formula functionality for complex calculations beyond standard analytics platforms
- Visual storytelling through charts, conditional formatting, and dashboard creation
- Data integration from multiple sources into unified reporting structures
Research demonstrates that Excel has evolved into a comprehensive analytics IDE, offering capabilities that extend far beyond simple spreadsheet functions. This evolution positions Excel as a legitimate business intelligence tool capable of handling sophisticated analytical workflows.
Building Effective Web Analytics Frameworks in Excel
Creating a robust web analytics consulting excel framework requires structured methodology. Consultants who master this approach deliver repeatable systems that clients can maintain and expand over time.
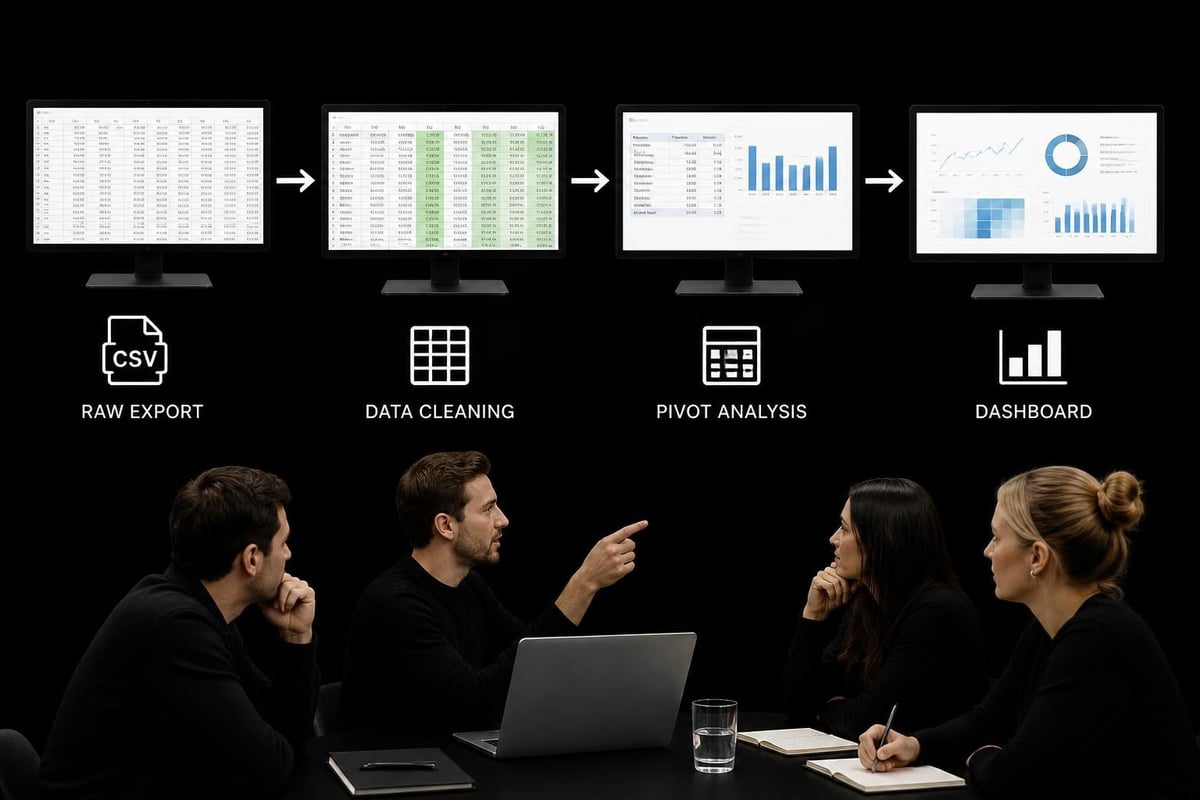
Data Collection and Import Strategies
The foundation begins with systematic data acquisition. Web analytics platforms typically offer multiple export options, and choosing the right format determines downstream efficiency.
| Export Format | Best Use Case | Excel Integration Method |
|---|---|---|
| CSV | Large datasets | Power Query import |
| Excel Direct | Automated reports | Direct connection |
| API Integration | Real-time data | VBA or Power Query M |
| Google Sheets | Collaborative analysis | Export or sync tools |
Most analytics consulting services emphasize establishing reliable data pipelines before analysis begins. This prevents the "garbage in, garbage out" scenario that undermines decision-making.
Essential Formulas for Web Analytics
Consultants specializing in web analytics consulting excel applications rely on specific formula combinations:
- SUMIFS and COUNTIFS for segmented traffic analysis across date ranges and sources
- INDEX-MATCH combinations for dynamic lookups between campaign data and conversion results
- Array formulas for calculating rolling averages and trend indicators
- Statistical functions like STDEV.P and CORREL for variance analysis and correlation testing
- Text manipulation using LEFT, RIGHT, MID, and TRIM for cleaning UTM parameters
Advanced users implement validation techniques to ensure data integrity throughout the analysis process. These controls prevent common errors that compromise analytical accuracy.
Dashboard Design for Web Analytics Insights
Transforming processed data into visual insights represents the culmination of web analytics consulting excel expertise. Well-designed dashboards communicate complex patterns quickly, enabling stakeholders to grasp performance trends at a glance.
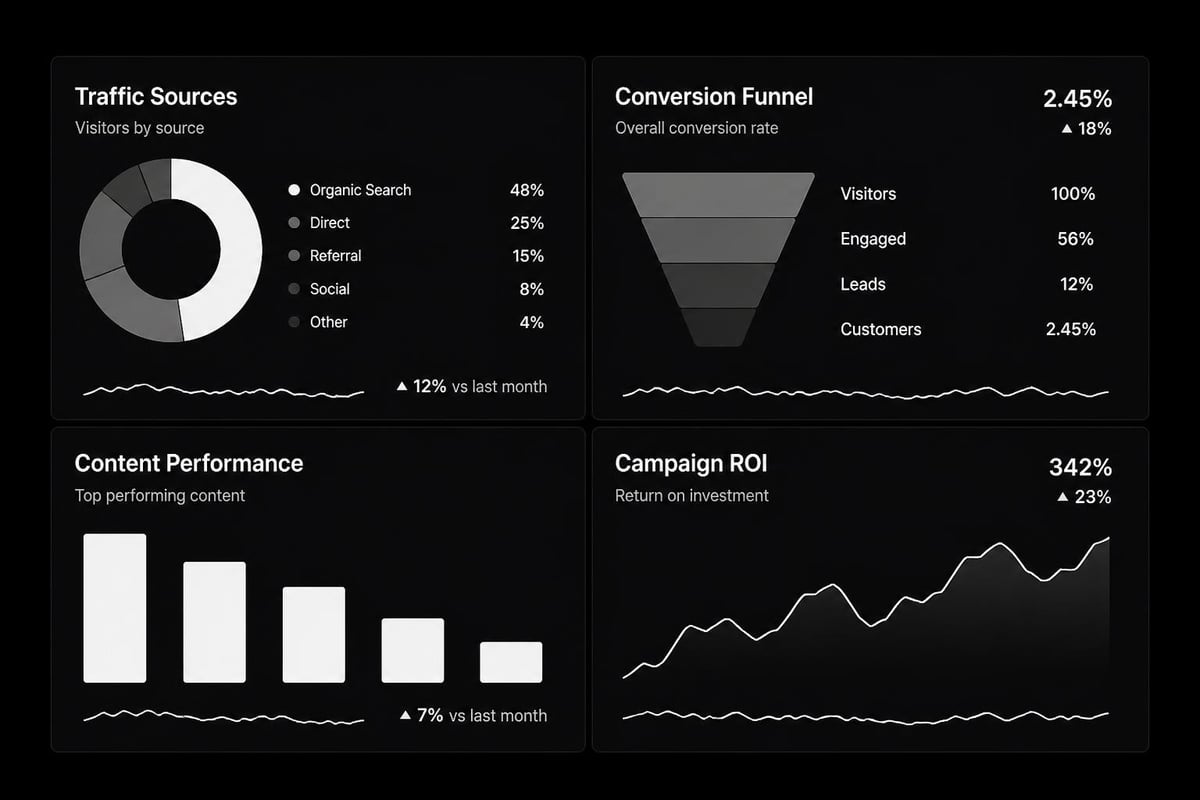
Core Metrics to Track
Effective web analytics dashboards prioritize metrics that align with business objectives:
- Traffic metrics: Sessions, users, page views, and bounce rate
- Engagement indicators: Average session duration, pages per session, scroll depth
- Conversion data: Goal completions, conversion rate, assisted conversions
- Attribution metrics: First-click, last-click, and multi-touch attribution models
- ROI calculations: Revenue per session, customer acquisition cost, lifetime value
Creating these measurements requires combining data from multiple sources. Professional analytics consulting typically involves integrating CRM data, advertising platform exports, and website analytics into unified Excel models.
Dynamic Reporting Structures
The most effective web analytics consulting excel solutions incorporate dynamic elements that update automatically as new data arrives:
Pivot tables form the backbone of dynamic reporting, allowing users to slice data across dimensions without rebuilding analysis structures. When combined with slicers and timeline controls, they create interactive exploration environments within Excel.
Conditional formatting highlights performance anomalies instantly. Traffic spikes, conversion rate drops, or unusual bounce patterns become immediately visible through color scales and icon sets. These visual cues guide attention toward areas requiring investigation.
Named ranges and structured references ensure formulas remain readable and maintainable. As advanced Excel projects grow in complexity, this organizational discipline prevents the "formula chaos" that plagues unstructured spreadsheets.
Advanced Analytical Techniques for Web Data
Moving beyond basic reporting, web analytics consulting excel expertise encompasses sophisticated analytical methods that reveal hidden patterns and predict future performance.
Cohort Analysis in Spreadsheets
Cohort analysis tracks user groups over time to understand behavior evolution. Excel's matrix structure naturally accommodates cohort tables, where rows represent acquisition periods and columns track subsequent time intervals.
This technique answers critical questions: Do users acquired in January retain better than February cohorts? Which traffic sources generate the highest lifetime value? How do conversion rates change as visitors mature?
Building cohort analysis requires careful date segmentation and formula design. The EDATE function combined with conditional logic creates time-based groupings, while SUMIFS aggregates metrics for each cohort-period intersection.
Attribution Modeling Beyond Last-Click
Most analytics platforms default to last-click attribution, crediting conversions entirely to the final touchpoint. This oversimplifies the customer journey and misallocates marketing resources.
Web analytics consulting excel approaches enable custom attribution models:
- Linear attribution: Equal credit across all touchpoints
- Time-decay models: Greater weight to recent interactions
- Position-based allocation: Emphasis on first and last touches
- Algorithm-driven weighting: Statistical models based on conversion probability
These models require path data showing complete customer journeys. Excel's formula capabilities calculate fractional credit across multiple rows, distributing conversion value according to chosen methodology.
Predictive Analytics Using Excel Functions
While specialized tools offer machine learning capabilities, Excel provides accessible forecasting through built-in functions and Analysis ToolPak features:
The FORECAST.ETS function applies exponential smoothing to time-series data, projecting future traffic or conversion volumes. This works particularly well for seasonal patterns where historical data informs future expectations.
Regression analysis through the Data Analysis add-in quantifies relationships between variables. Does increased blog traffic correlate with product sales? How much does email campaign frequency impact conversion rate? These questions yield to Excel's regression capabilities.
Integrating Multiple Data Sources
The true power of web analytics consulting excel emerges when combining website metrics with broader business data. This integration transforms isolated analytics into comprehensive business intelligence.
Connecting CRM and Analytics Data
Customer lifetime value calculations require matching website behavior with sales outcomes. Excel's relationship tools, particularly Power Pivot, enable joining datasets on common identifiers like email addresses or customer IDs.
Once connected, analysts can answer questions like: Which content topics attract the highest-value customers? What traffic sources generate leads with the best close rates? These insights guide resource allocation more effectively than traffic volume alone.
Research on web data integration demonstrates how spreadsheet users can incorporate diverse data sources without extensive programming knowledge, making sophisticated analysis accessible to non-technical consultants.
Combining Paid and Organic Performance
Marketing teams often manage paid advertising and organic content separately, losing sight of interactions between channels. Web analytics consulting excel frameworks unify these streams.
A comprehensive view requires importing Google Ads data, social media metrics, email campaign results, and organic search performance into coordinated Excel models. Pivot tables then cross-tabulate performance across channels, revealing synergies and cannibalization effects.
| Channel | Sessions | Conversion Rate | Cost per Acquisition | Assisted Conversions |
|---|---|---|---|---|
| Organic Search | 12,450 | 3.2% | $0 | 245 |
| Paid Search | 8,320 | 4.1% | $42 | 168 |
| Social Organic | 6,890 | 1.8% | $0 | 312 |
| Social Paid | 4,200 | 2.9% | $38 | 94 |
This consolidated perspective, updated through automated data refreshes, keeps marketing strategy aligned with actual performance rather than channel-specific assumptions.
Automation and Efficiency in Excel Analytics
Manual data processing consumes time better spent on insight generation. Web analytics consulting excel expertise includes automation strategies that minimize repetitive tasks.
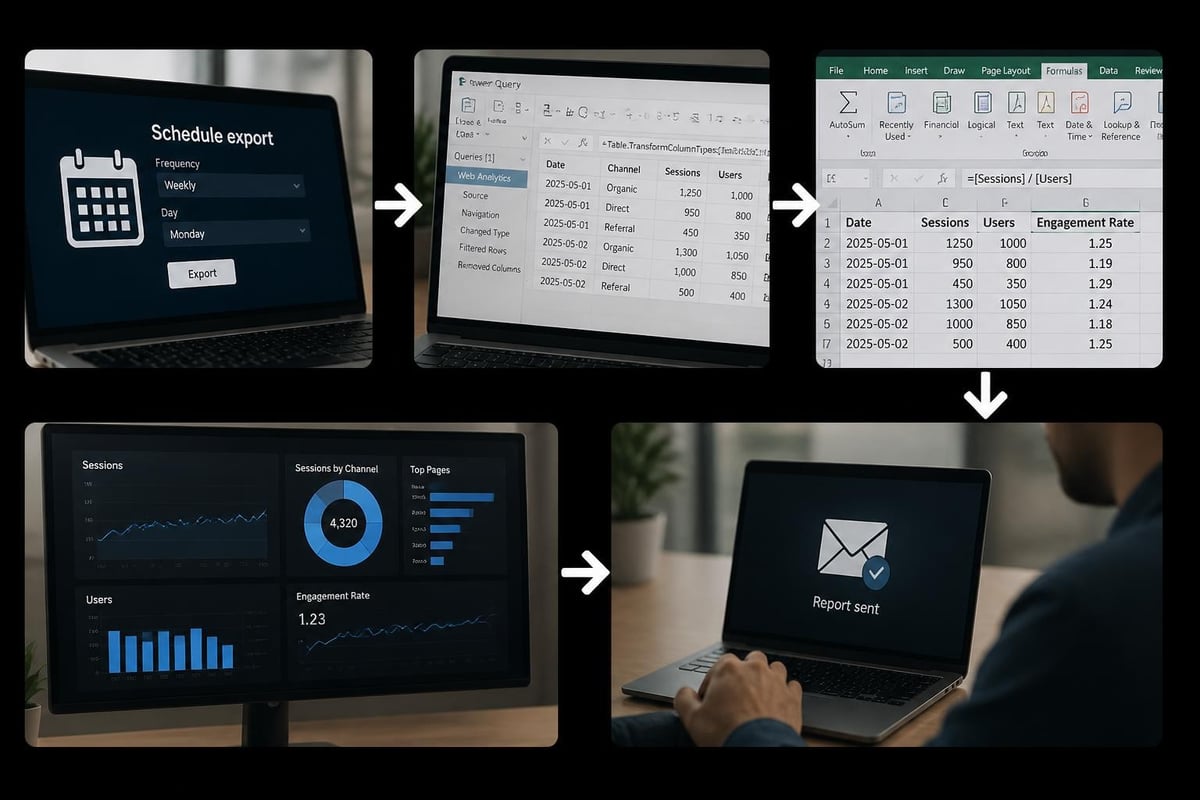
Power Query for Data Transformation
Power Query revolutionizes how Excel handles external data. This tool connects directly to analytics platforms, databases, and web sources, applying transformation logic automatically whenever data refreshes.
Consultants build Query sequences that clean column names, filter date ranges, remove duplicates, merge datasets, and reshape tables-all without manual intervention. Once configured, these sequences execute with a single click or on schedule.
The visual interface makes Query accessible to users uncomfortable with traditional programming, though the underlying M language offers sophisticated capabilities for those who need them.
VBA Macros for Complex Workflows
When automation requirements exceed Power Query's capabilities, VBA (Visual Basic for Applications) provides programmatic control over Excel operations. Macros can orchestrate multi-step processes like generating dozens of customized reports or updating complex dashboard elements.
Common web analytics consulting excel macro applications include:
- Importing and processing multiple CSV files from a folder
- Generating client reports with dynamic date ranges and filters
- Sending automated email alerts when KPIs exceed thresholds
- Creating backup versions before major data refreshes
- Validating data quality across multiple worksheets
Users can enable macros safely while maintaining security protocols that protect against malicious code.
Security and Governance Considerations
As web analytics consulting excel solutions grow more sophisticated, they contain increasingly sensitive business intelligence. Proper security protocols protect this valuable asset.
Protecting Sensitive Analytics Data
Excel offers multiple security layers appropriate for different scenarios:
Worksheet protection prevents accidental formula changes while allowing data entry in designated cells. This proves essential when multiple team members interact with shared analytics workbooks.
Workbook encryption with password protection secures entire files against unauthorized access. Modern Excel encryption uses AES-256, providing enterprise-grade security for confidential business data.
Cell locking strategies selectively restrict editing permissions, allowing stakeholders to view dashboards and interact with filters without accessing underlying calculations or raw data.
Organizations with compliance requirements should implement version control, audit trails, and formal review processes around analytics workbooks that inform significant business decisions.
Data Quality Assurance
Analytics accuracy depends on data integrity throughout the processing pipeline. Web analytics consulting excel frameworks incorporate validation at multiple checkpoints:
Range validation ensures imported values fall within expected parameters. A 150% bounce rate signals import errors rather than actual user behavior. Formula-based checks flag these anomalies for investigation.
Reconciliation procedures compare Excel calculations against source platform totals. Discrepancies indicate filtering errors, date range mismatches, or other processing problems requiring correction.
Documentation standards make spreadsheets maintainable over time. Clear worksheet labels, formula comments, and methodology notes enable transitions when staff changes occur or consultants hand off completed projects.
Training Teams for Self-Sufficiency
The best web analytics consulting excel engagements build client capabilities rather than creating dependency. Effective knowledge transfer ensures organizations can maintain and extend analytics systems independently.
Structured Learning Approaches
Successful training programs progress from foundational concepts through advanced techniques:
- Data literacy fundamentals: Understanding metrics, dimensions, and analytical thinking
- Excel skill building: Formulas, tables, charts, and basic automation
- Analytics-specific techniques: Pivot tables for traffic analysis, cohort construction, attribution modeling
- Maintenance procedures: Data refreshes, quality checks, troubleshooting common issues
- Extension capabilities: Adding new metrics, modifying dashboards, incorporating additional data sources
Professional Excel training accelerates team development, transforming casual spreadsheet users into confident analysts capable of extracting meaningful insights from complex data.
Building Sustainable Analytics Cultures
Technology alone doesn't guarantee analytical success. Organizations need cultural elements that value data-driven decision-making:
Regular review cadences where teams examine performance trends and discuss strategic implications embed analytics into operational rhythms. When dashboard reviews become routine, insights flow into action.
Curiosity encouragement prompts team members to ask deeper questions beyond standard reports. What explains the traffic spike on Tuesday? Why do mobile conversions lag desktop? This investigative mindset uncovers improvement opportunities.
For businesses seeking comprehensive growth strategies, partnering with lead generation specialists can complement analytics capabilities by transforming insights into qualified sales opportunities through targeted campaigns and automated systems.
Scaling Web Analytics Excel Systems
As businesses grow, their analytics requirements expand in complexity and volume. Web analytics consulting excel solutions must scale accordingly without sacrificing performance or usability.
Performance Optimization Strategies
Large datasets strain Excel's calculation engine. Consultants employ specific techniques to maintain responsiveness:
Calculated columns versus measures: In Power Pivot, measures (calculated at query time) generally outperform calculated columns (stored with data) for aggregations across millions of rows.
Formula efficiency: SUMIFS typically outperforms SUMPRODUCT for conditional aggregation. Looking up values efficiently using XLOOKUP instead of nested IF statements reduces calculation overhead.
Table structures: Converting ranges to proper Excel tables improves formula performance and enables structured references that automatically expand as data grows.
Calculation modes: Setting manual calculation for large workbooks prevents Excel from recalculating after every cell change, allowing batch updates when convenient.
When to Graduate Beyond Excel
Excel handles impressive data volumes, but certain scenarios justify transitioning to specialized platforms:
When datasets regularly exceed several million rows, database systems with SQL interfaces provide better performance. Excel can still serve as the front-end reporting layer via external data connections.
When dozens of users need simultaneous access, collaborative BI platforms offer advantages over shared Excel files, which struggle with concurrency.
When real-time analysis becomes critical, streaming analytics platforms provide capabilities Excel cannot match. However, Excel often remains valuable for ad-hoc exploration of subsets from real-time systems.
Research on big data frameworks designed for non-technical users demonstrates that accessibility remains paramount even when data volumes grow. The best solutions preserve usability while expanding capabilities.
Industry-Specific Applications
Web analytics consulting excel techniques adapt to various business contexts, each with unique measurement priorities and analytical challenges.
E-commerce Analytics
Online retailers focus on metrics like cart abandonment rate, product affinity, and customer segment value. Excel models track these through custom calculations connecting session data with transaction exports.
Basket analysis reveals which products frequently purchase together, informing cross-sell strategies. Cohort analysis by acquisition channel shows which traffic sources generate customers with highest lifetime value.
Content Publishers
Media sites prioritize engagement metrics: time on page, scroll depth, social sharing, and return visitor rates. Excel dashboards segment these metrics by content category, author, and traffic source.
Trend analysis identifies emerging topics before they peak, allowing editorial teams to capitalize on growing interest. Attribution models connect initial content consumption with eventual subscription conversions.
Lead Generation Businesses
Organizations focused on capturing qualified leads measure form completions, lead quality scores, and progression through sales funnels. Web analytics consulting excel frameworks connect website behavior with CRM outcomes.
Traffic source analysis by lead quality-not just volume-reveals which channels deserve increased investment. This often contradicts assumptions based solely on visitor counts or cost per click.
Emerging Capabilities and Future Directions
The web analytics consulting excel landscape continues evolving as both web technologies and Excel capabilities advance.
Integration with Modern Analytics Platforms
Google Analytics 4's event-based model generates more granular data than universal analytics. Excel consultants are adapting frameworks to handle this increased dimensionality while maintaining reporting clarity.
API connections enable direct data pulls into Excel without manual exports. Modern analytics implementations often include automated pipelines that keep Excel dashboards current without human intervention.
Artificial Intelligence Enhancements
Excel's AI-powered features like Ideas (automatic insight generation) and data types (which pull live information from web sources) expand analytical capabilities without requiring formula expertise.
These tools democratize analysis, allowing business users to explore patterns that previously demanded statistical knowledge. However, human judgment remains essential for interpreting suggestions and validating recommendations.
Cross-Platform Collaboration
Excel's evolution toward cloud-based collaboration through Microsoft 365 enables real-time co-authoring on analytics workbooks. Multiple stakeholders can simultaneously review dashboards, add comments, and propose adjustments.
This shift mirrors broader workplace trends toward distributed teams and asynchronous collaboration, making web analytics consulting excel solutions more accessible to geographically dispersed organizations.
Measuring Analytics ROI
Organizations investing in web analytics consulting excel capabilities naturally question returns. Several frameworks quantify analytical value:
Decision improvement metrics compare outcomes before and after implementing data-driven processes. Did marketing efficiency increase? Did product launch success rates improve? These changes demonstrate analytical impact.
Time savings calculations measure hours reclaimed through automation versus manual reporting. When weekly report generation drops from eight hours to thirty minutes, that productivity gain translates directly to cost savings or redeployed capacity.
Revenue attribution connects specific insights to business outcomes. If analytics reveals an underperforming traffic source that's subsequently optimized, the resulting revenue increase validates the analytical investment.
Analytics consulting services typically generate returns exceeding their costs within quarters rather than years, particularly when implementation includes capability building that creates ongoing value.
Web analytics consulting excel represents a powerful combination that transforms website data into strategic intelligence without requiring enterprise software investments. By mastering data integration, formula techniques, dashboard design, and automation strategies, businesses extract maximum value from their digital presence while building sustainable analytical capabilities. Whether your spreadsheets need optimization, your team requires training, or you're ready to build comprehensive analytics frameworks, The Analytics Doctor provides the expertise to diagnose issues and implement solutions that make your data work smarter for your business objectives.