Business intelligence in 2026 requires more than collecting website data. Organizations need professionals who can bridge the gap between Google Analytics platforms and the spreadsheet tools teams use daily. A google analytics expert consultant excel specialist combines deep analytics knowledge with advanced spreadsheet skills, transforming complex web metrics into clear, actionable reports that drive strategic decisions. This unique combination of expertise addresses a critical business need: converting raw tracking data into formats that stakeholders actually understand and use.
Why Excel Remains Essential for Analytics Reporting
Despite the proliferation of sophisticated dashboard tools and visualization platforms, Microsoft Excel continues to dominate business reporting environments. The spreadsheet application offers flexibility, familiarity, and functionality that specialized tools cannot match for many organizations.
Excel provides several advantages for analytics work:
- Universal accessibility across organizations without specialized software requirements
- Powerful calculation engines for custom metrics and KPIs
- Flexible formatting options that match corporate reporting standards
- Offline analysis capabilities when internet connectivity is limited
- Integration with existing business processes and workflows
Most professionals already possess basic Excel skills, reducing the learning curve for consuming analytics reports. When a google analytics expert consultant excel professional delivers insights through familiar spreadsheet formats, adoption rates increase dramatically compared to proprietary dashboard solutions.
The Data Translation Challenge
Google Analytics 4 (GA4) generates enormous volumes of event-based data that overwhelm most business users. Strategic GA4 setup and consulting services focus on configuration, but the presentation layer often determines whether insights actually influence decisions.
Raw exports from GA4 contain cryptic parameter names, nested data structures, and technical jargon that confuses non-technical stakeholders. A skilled consultant transforms these exports into clean Excel reports featuring calculated fields, conditional formatting, and automated refresh mechanisms that keep information current.

Core Competencies of Analytics Excel Specialists
Effective google analytics expert consultant excel professionals possess multidisciplinary expertise spanning web analytics, spreadsheet engineering, and business intelligence principles.
Technical Analytics Knowledge
Understanding GA4's data model, tracking architecture, and reporting API represents the foundation. Consultants must interpret measurement protocols, debug tracking implementations, and validate data accuracy before building Excel-based reporting systems.
Critical analytics competencies include:
- Event taxonomy design and parameter configuration
- Conversion tracking setup and attribution modeling
- Audience segmentation and cohort analysis
- Cross-domain tracking and data stream management
- Custom dimension and metric implementation
These technical skills ensure that data flowing into Excel reports maintains integrity and accuracy. Comprehensive web analytics services emphasize proper implementation, which directly impacts downstream reporting quality.
Advanced Excel Engineering
Beyond basic formulas, professional-grade analytics reporting requires sophisticated spreadsheet techniques. Power Query enables automated data extraction from GA4 APIs, while Power Pivot handles millions of rows that exceed standard worksheet limits.
| Excel Feature | Analytics Application | Business Value |
|---|---|---|
| Power Query | Automated GA4 API connections | Eliminates manual exports |
| Pivot Tables | Multi-dimensional metric analysis | Interactive exploration |
| DAX Formulas | Calculated metrics and KPIs | Custom business logic |
| Conditional Formatting | Alert highlighting and trends | Visual anomaly detection |
| Named Ranges | Dynamic chart updates | Self-maintaining dashboards |
The advanced Excel projects offered by specialists demonstrate how complex business requirements translate into elegant spreadsheet solutions that non-technical users can operate confidently.
Business Acumen and Communication
Technical proficiency alone does not create valuable analytics programs. Understanding business contexts, industry benchmarks, and stakeholder priorities determines which metrics matter and how to present findings effectively.
A google analytics expert consultant excel specialist asks clarifying questions about business objectives before touching data. Which customer segments drive profitability? What conversion paths require optimization? How do seasonal patterns affect performance comparisons?
These conversations shape reporting frameworks that answer actual business questions rather than simply displaying available metrics. Google Analytics consulting packages that include business analysis deliver far greater ROI than purely technical implementations.
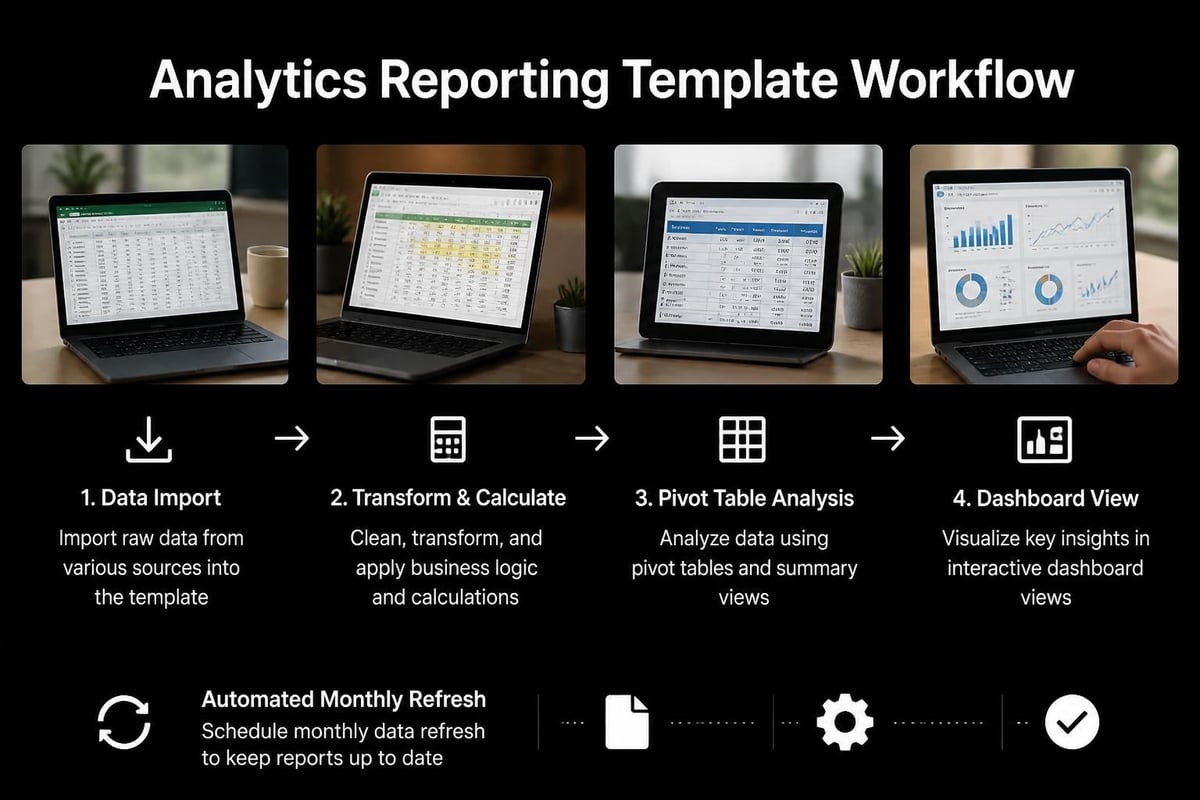
Building Excel-Based Analytics Systems
Constructing robust reporting infrastructure requires systematic approaches that balance automation with flexibility. The most effective systems minimize manual work while preserving customization options for evolving business needs.
Data Connection Architecture
Modern Excel offers multiple methods for connecting to Google Analytics data sources. The API approach provides programmatic access to raw event data, while scheduled exports create intermediate CSV files for processing.
API-based connections deliver several benefits:
- Real-time or scheduled automatic updates
- Parameter-driven queries for flexible date ranges
- Consistent data structures across reporting periods
- Reduced human error from manual processes
Setting up these connections requires authentication configuration, query construction, and error handling logic. Many organizations leverage professional Excel consulting services to establish initial frameworks that internal teams then maintain.
Report Template Development
Well-designed templates transform raw analytics data into decision-ready insights through calculated fields, standardized layouts, and visual hierarchies that guide reader attention.
Effective templates include multiple worksheet tabs serving distinct purposes: raw data storage, calculation engines, pivot analysis areas, and formatted output dashboards. This separation maintains data integrity while enabling flexible analysis approaches.
Professional google analytics expert consultant excel developers build templates with documentation, field definitions, and update instructions so non-technical users can operate systems independently. Excel training programs that cover template maintenance empower organizations to reduce ongoing consulting dependencies.
Automation and Refresh Workflows
Manual data updates create bottlenecks and introduce errors. Automated refresh systems ensure reports reflect current information without human intervention.
- Configure Power Query connections to GA4 export locations or API endpoints
- Set up refresh schedules through Excel's data connection properties
- Build validation checks that flag incomplete or anomalous data loads
- Create notification systems alerting stakeholders when reports update
- Document troubleshooting procedures for connection failures or data issues
These automation investments pay dividends through time savings and improved data freshness. Organizations often discover that professional Excel help during initial setup costs less than ongoing manual reporting labor.
Common Analytics Excel Challenges and Solutions
Even experienced professionals encounter obstacles when merging analytics platforms with spreadsheet tools. Understanding typical challenges accelerates problem resolution and improves system reliability.
Data Volume Management
GA4 exports for high-traffic websites easily exceed Excel's worksheet row limits. A google analytics expert consultant excel specialist employs several strategies to address scale challenges.
Volume management techniques:
- Pre-filtering data through API queries to relevant date ranges and dimensions
- Aggregating metrics to appropriate time granularities before import
- Leveraging Power Pivot's xVelocity engine for million-row datasets
- Implementing incremental refresh patterns that append only new data
- Creating separate workbooks for different reporting periods
| Challenge | Impact | Solution Approach |
|---|---|---|
| Row limit exceeded | Data truncation | Power Pivot or data aggregation |
| Slow calculation times | User frustration | Optimized formulas and manual calc mode |
| File size bloat | Sharing difficulties | Separate data and presentation files |
| Memory constraints | Application crashes | 64-bit Excel and incremental loads |
Professional implementations often split data storage from presentation, with backend workbooks housing connections and calculations while frontend files link to processed results. This architecture improves performance and simplifies distribution.
Attribution and Conversion Tracking
Accurately attributing conversions across customer touchpoints challenges even sophisticated analytics setups. Excel-based attribution modeling requires careful logic design and validation against platform reporting.
Analytics consulting services focused on GA4 help establish proper conversion tracking that feeds clean data into Excel models. Once tracking operates correctly, spreadsheet logic can apply custom attribution rules matching specific business contexts.
Data Quality and Validation
Analytics data quality issues multiply when moved into Excel environments. Missing values, duplicate records, and inconsistent naming conventions require systematic cleaning procedures.
Validation workflows should include automated checks comparing Excel calculations against source platform totals. Discrepancies signal data quality issues, transformation errors, or tracking problems requiring investigation. The services provided by analytics specialists often include ongoing data quality monitoring alongside initial system development.
Integration Strategies for Complete Analytics Stacks
Google Analytics rarely exists in isolation. Modern organizations employ marketing automation platforms, CRM systems, and advertising networks that generate complementary data requiring integration for comprehensive analysis.
Multi-Source Data Consolidation
A google analytics expert consultant excel professional designs integration frameworks that combine website analytics with sales data, email metrics, and advertising performance into unified reporting environments.
Power Query's ability to connect diverse data sources makes Excel an effective integration platform. Consultants build query libraries that standardize field names, reconcile date formats, and merge datasets through common keys.
Integration complexity tiers:
- Simple append queries combining GA4 data from multiple properties
- Lookup-based enrichment adding CRM customer attributes to web sessions
- Complex joins matching advertising click IDs to conversion outcomes
- Calculated attribution distributing revenue across touchpoint sequences
Each integration tier requires progressively sophisticated Excel techniques and deeper understanding of source system data structures. Custom Excel solutions address unique integration requirements that generic tools cannot accommodate.
Dashboard and Visualization Design
While Excel lacks the interactive sophistication of dedicated BI platforms, thoughtful design produces highly effective static and semi-interactive dashboards that meet most organizational reporting needs.
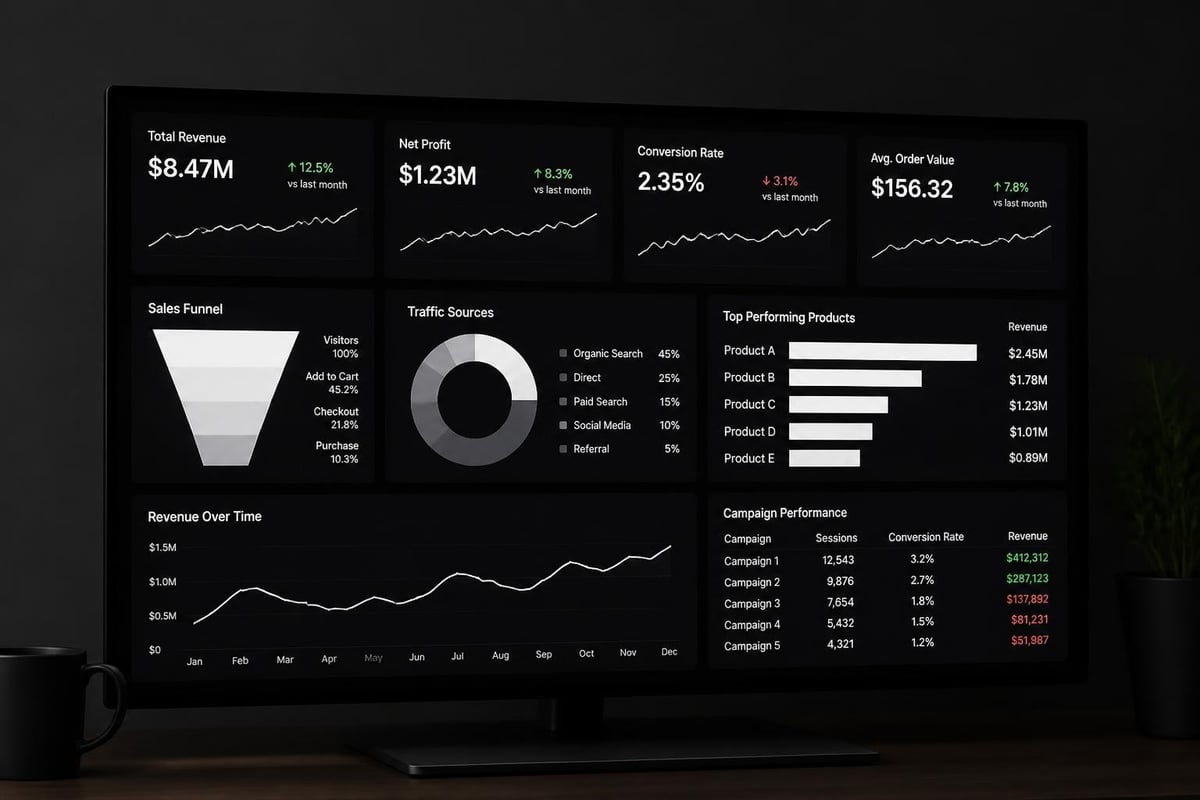
Effective dashboards balance information density with visual clarity. Key metrics receive prominent placement with clear labels and context. Trends appear through sparklines or small multiples showing patterns across segments. Conditional formatting highlights exceptions requiring attention.
Professional dashboard design follows established principles: logical information flow from summary to detail, consistent color coding across metrics, and appropriate chart types for different data relationships. Excel training focused on business analytics teaches these visualization principles alongside technical formula skills.
Measuring ROI from Analytics Excel Investments
Organizations investing in google analytics expert consultant excel resources should establish clear success metrics that justify ongoing consulting relationships or internal capability development.
Time Savings Quantification
Manual reporting processes consume substantial staff hours that automated Excel systems reclaim for higher-value analysis activities. Document baseline time requirements before automation, then measure reduction post-implementation.
Typical time savings areas:
- Data export and formatting: 75-90% reduction
- Report generation and distribution: 60-80% reduction
- Quality checking and validation: 40-60% reduction
- Ad-hoc analysis requests: 30-50% reduction
These efficiency gains translate directly to cost savings or capacity increases. A marketing team spending 20 hours weekly on manual reporting reclaims 15 hours through automation, equivalent to adding fractional headcount without hiring.
Decision Quality Improvements
More valuable than time savings, effective analytics reporting improves decision quality through timely insights and comprehensive data visibility. Track business outcomes influenced by analytics-driven decisions.
Did campaign optimizations based on Excel attribution reports improve ROAS? Have conversion rate improvements followed funnel analysis recommendations? Do executive dashboards correlate with faster strategic pivots?
User Adoption Metrics
The best-designed systems fail if stakeholders do not use them. Monitor report consumption, feedback quality, and self-service analysis frequency as adoption indicators.
| Metric | Target | Measurement Method |
|---|---|---|
| Report open rate | >80% of recipients | Email tracking or file access logs |
| Update frequency | Weekly minimum | Automated timestamps |
| Support tickets | <5% of users monthly | Help desk tracking |
| Self-service queries | Growing trend | Power Query usage stats |
High adoption rates validate that Excel-based analytics meet stakeholder needs through appropriate complexity levels and relevant metrics. Professional analytics consulting includes user feedback collection and iterative refinement to maximize adoption.
Selecting the Right Analytics Excel Partner
Organizations lacking internal expertise face build-versus-buy decisions regarding analytics reporting capabilities. Understanding consultant selection criteria ensures successful partnerships.
Evaluation Criteria for Consultants
A qualified google analytics expert consultant excel professional demonstrates proficiency across multiple dimensions beyond pure technical skills.
Assessment areas include:
- Portfolio review showing similar client work and complexity levels
- Technical certification in both Google Analytics and Microsoft Excel
- Business domain knowledge relevant to your industry context
- Communication style matching organizational culture preferences
- Support model defining ongoing maintenance and training approaches
Request reference conversations with existing clients to understand working relationships, responsiveness, and long-term satisfaction. The strongest consultants build lasting partnerships rather than transactional project relationships.
Project Scope Definition
Clear scope documentation prevents misaligned expectations and budget overruns. Define specific deliverables, success criteria, timeline milestones, and responsibility boundaries before engagement begins.
Typical project phases include discovery and requirements gathering, data connection setup, template development, testing and validation, training and knowledge transfer, and ongoing support arrangements. Each phase should have explicit deliverables and acceptance criteria.
Knowledge Transfer Planning
Sustainable analytics programs require internal capability development, not permanent consultant dependencies. Effective engagements include comprehensive documentation, training sessions, and gradual responsibility transition to internal teams.
Personalized Excel training tailored to your specific reporting templates accelerates team proficiency and reduces long-term consulting costs while maintaining system quality.
Future Trends in Analytics and Excel Integration
The analytics landscape continues evolving rapidly, with implications for how google analytics expert consultant excel professionals approach their work in 2026 and beyond.
Artificial Intelligence Augmentation
Excel's integration of AI capabilities through features like Ideas and Analyze Data brings automated insight generation to spreadsheet environments. These tools identify trends, anomalies, and patterns that manual analysis might miss.
Future developments will likely include natural language querying of analytics data, automated report generation from prompts, and predictive modeling accessible through familiar Excel interfaces. Consultants who master AI-augmented analytics delivery will provide differentiated value.
Privacy and Data Governance
Tightening privacy regulations and cookie deprecation force analytics evolution toward privacy-preserving measurement approaches. Excel-based reporting systems must adapt to aggregated data, modeling-based attribution, and consent-aware segmentation.
Consultants now address data governance requirements including access controls, audit trails, and compliance documentation as core system components rather than afterthoughts. Organizations seeking Google Analytics 360 services with enterprise governance need corresponding Excel security frameworks.
Cloud-Based Collaboration
Excel's evolution toward cloud-native collaboration through Microsoft 365 enables real-time multi-user editing and browser-based access without desktop application requirements. These capabilities transform how analytics teams collaborate on report development and stakeholder interaction.
Cloud-connected Excel workbooks can refresh from Google Analytics APIs on automated schedules without user intervention, publish to SharePoint libraries for governed distribution, and integrate with Power BI for hybrid reporting architectures combining Excel flexibility with advanced visualization capabilities.
Bridging Google Analytics expertise with Excel proficiency creates powerful business intelligence capabilities that transform raw web data into actionable insights through tools your teams already know and trust. Whether you need automated reporting systems, custom analysis templates, or training to maximize your existing analytics investments, The Analytics Doctor specializes in diagnosing spreadsheet challenges and delivering practical solutions that make your data work harder for your business.