Data analysts spend countless hours wrestling with spreadsheets, cleaning messy datasets, and transforming numbers into meaningful insights. With artificial intelligence becoming an essential tool in 2026, knowing the best AI prompts for data analysts can dramatically reduce tedious work while improving accuracy. Whether you're managing complex Excel workbooks or preparing data for stakeholder presentations, the right prompts turn AI assistants into powerful analytical partners that understand your specific needs and deliver actionable results.
Understanding AI Prompts for Data Analysis Work
AI prompts serve as instructions that guide artificial intelligence tools to perform specific analytical tasks. The quality of your output depends entirely on how well you structure these requests.
Effective prompts share three critical characteristics: clarity in the objective, context about your data structure, and specific formatting requirements for the output. A vague request like "analyze my sales data" produces generic results, while a detailed prompt specifying columns, time periods, and desired metrics generates targeted insights you can immediately apply.
For Excel users, AI prompts bridge the gap between manual formula writing and automated analysis. Instead of spending hours researching the right combination of functions, you can describe what you need and receive working formulas, data cleaning steps, or visualization recommendations tailored to your spreadsheet structure.
Why Context Matters in Prompt Engineering
The difference between mediocre and exceptional AI responses lies in contextual information. When you provide details about your industry, data volume, column names, and business objectives, AI tools can offer solutions that align with your specific analytical framework.
Consider these context elements:
- Data structure details: Number of rows, column headers, data types
- Business context: Industry terminology, key performance indicators, reporting requirements
- Technical constraints: Software limitations, formula complexity preferences, processing speed needs
- Output preferences: Chart types, table formats, summary statistics desired
Research on how analysts structure prompts to align with analytical frameworks demonstrates that contextual prompts reduce iteration time by up to 60% compared to generic requests.
Data Cleaning Prompts That Save Hours
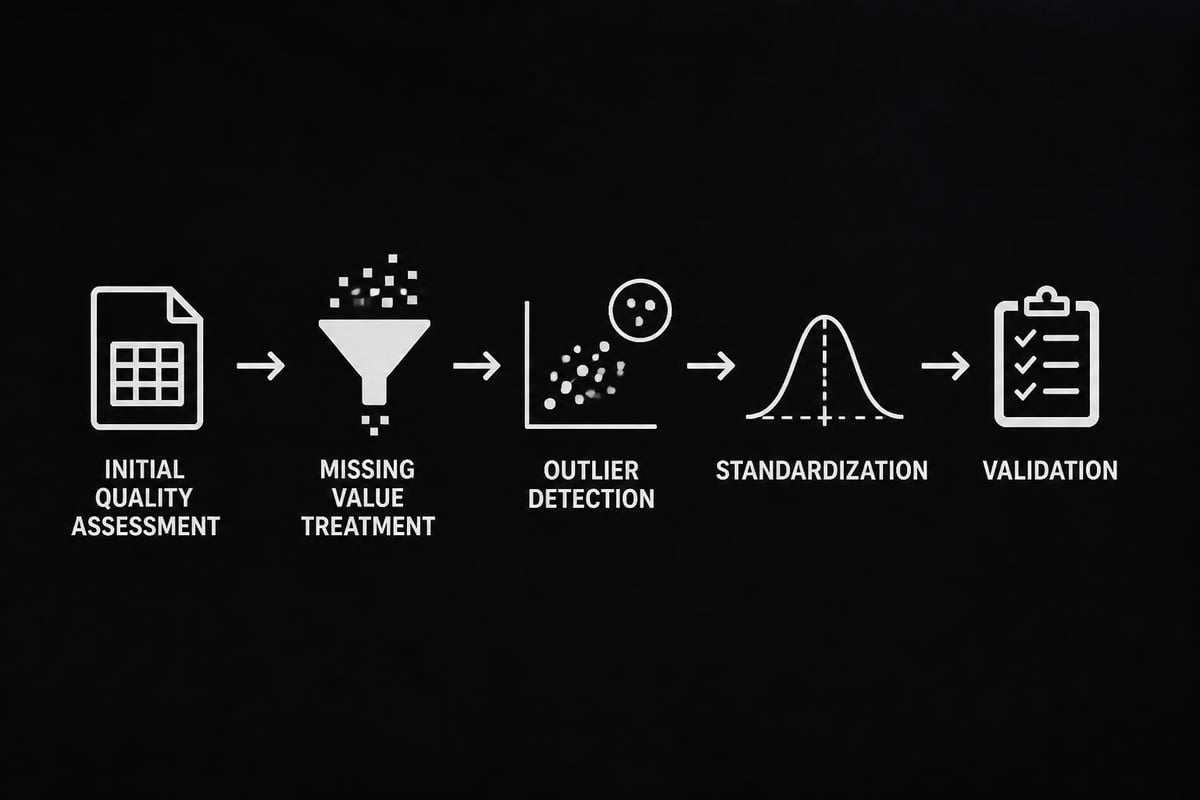
Data cleaning consumes roughly 60% of analyst time, making it the perfect area to leverage AI assistance. The best AI prompts for data analysts in this category focus on systematic identification and resolution of data quality issues.
Systematic Data Quality Assessment
Start with a comprehensive diagnostic prompt:
"Analyze this dataset with columns [list column names]. Identify: 1) Missing values by column with percentages, 2) Duplicate records based on [key fields], 3) Outliers in numerical columns using IQR method, 4) Data type inconsistencies, 5) Invalid entries that don't match expected patterns. Present findings in a prioritized table with severity ratings and recommended actions."
This structured approach mirrors how professional data cleaning prompts guide systematic inspection to ensure nothing gets overlooked.
Targeted Cleaning Operations
| Cleaning Task | Effective Prompt Structure | Output Format |
|---|---|---|
| Missing Values | "For column [name] with [X]% missing values, recommend imputation strategy based on data distribution and business context [describe]. Provide Excel formula or Python code." | Formula + explanation |
| Duplicates | "Identify duplicate rows in columns [list] where [conditions]. Generate formula to flag duplicates keeping [first/last/specific criteria] record." | Conditional formula |
| Standardization | "Standardize [column name] containing [data type] with variations like [examples]. Create cleaning steps to convert all entries to [standard format]." | Step-by-step procedure |
| Outliers | "Detect outliers in [column] using [method]. For each outlier, suggest whether to remove, cap, or investigate based on [business rules]." | Flagged records + actions |
When working with complex Excel formulas, understanding how to properly structure them can prevent errors. If you're implementing automated cleaning through macros, knowing how to enable macros in Excel ensures your AI-generated solutions run smoothly.
Text and Date Standardization
"I have a column with inconsistent date formats including 'MM/DD/YYYY', 'DD-MM-YY', and text entries like 'Jan 15, 2026'. Create an Excel formula that converts all entries to YYYY-MM-DD format, flagging any entries that cannot be converted."
This prompt produces specific formulas you can immediately implement, saving the trial-and-error process of testing different date functions.
Exploratory Data Analysis Prompts
Once your data is clean, exploratory analysis reveals patterns and relationships that inform business decisions. Effective prompts in this phase request both statistical summaries and contextual interpretations.
Initial Dataset Overview
"Provide an exploratory analysis of this dataset: [paste sample rows or describe structure]. Include: descriptive statistics for numerical columns, frequency distributions for categorical variables, correlation matrix for [specific columns], and three preliminary insights about relationships between [relevant variables]. Format as executive summary with supporting tables."
The comprehensive nature of data exploration prompts helps analysts understand dataset structures quickly without writing multiple individual queries.
Pattern Recognition Requests
Move beyond basic statistics with pattern-focused prompts:
- "Identify seasonal patterns in [column] across [time period]. Calculate month-over-month growth rates and flag any months with anomalous performance exceeding [threshold]% deviation from average."
- "Segment customers in this dataset based on [behavioral columns]. Propose 3-5 distinct segments with defining characteristics and business implications for each group."
- "Analyze the relationship between [variable A] and [variable B], controlling for [variable C]. Suggest appropriate statistical test and provide interpretation for non-technical stakeholders."
For correlation analysis in Excel, you might need to calculate correlation coefficients to validate AI-generated insights with native Excel functions.
Distribution Analysis
"Examine the distribution of [column name]. Determine if it follows normal, skewed, or bimodal pattern. Recommend appropriate transformation if needed for analysis. Provide histogram bin recommendations and summary statistics including mean, median, mode, standard deviation, skewness, and kurtosis."
This prompt generates a complete statistical profile that informs subsequent analytical decisions.
Visualization and Reporting Prompts
Translating data into visual stories requires careful consideration of audience, message, and medium. The best AI prompts for data analysts in visualization go beyond requesting a chart type to specifying communication objectives.
Chart Selection and Design
"I need to show [specific insight] to [audience type]. Dataset includes [variables]. Recommend the most effective visualization type, explain why it's appropriate for this message, and provide specifications for axes, color coding, labels, and annotations that enhance comprehension."
Studies on effective data visualization prompts reveal that specifying the communication goal produces more appropriate chart recommendations than describing data alone.
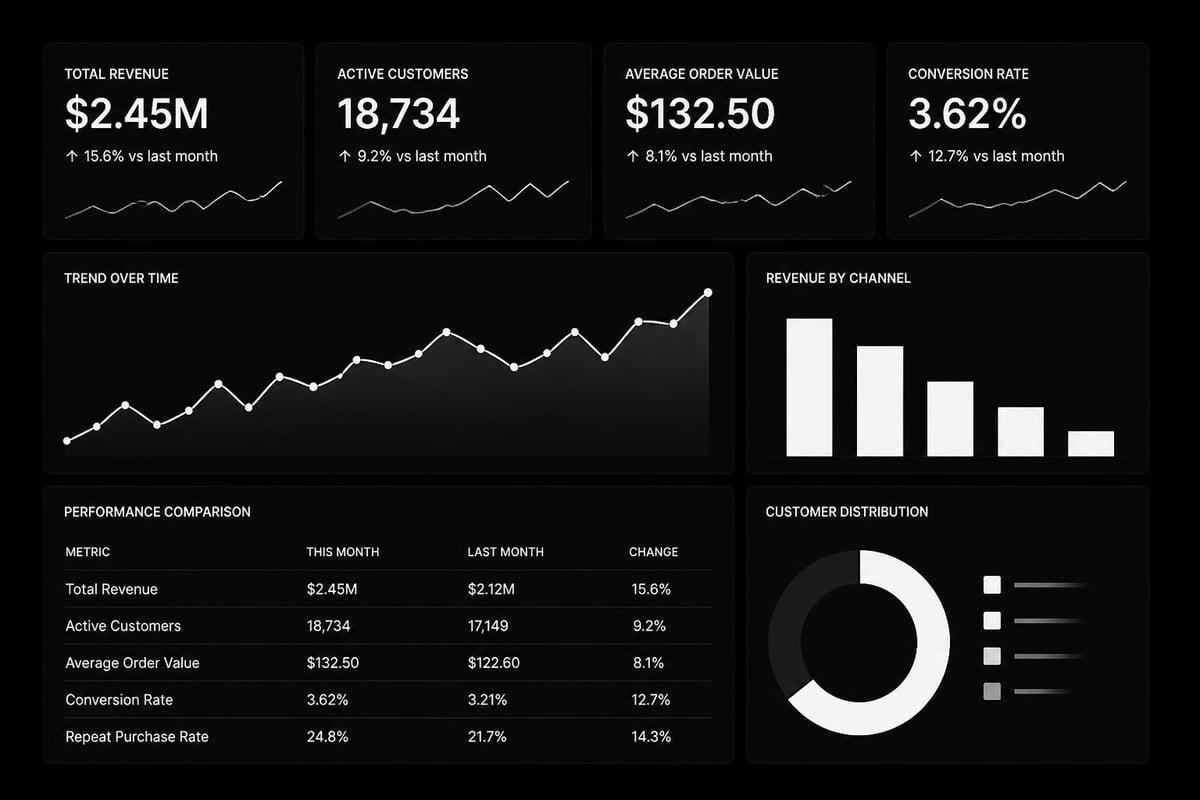
Dashboard Creation Strategies
| Dashboard Element | Prompt Template | Key Considerations |
|---|---|---|
| KPI Metrics | "Design a KPI dashboard section tracking [metrics]. Specify: current value, comparison period, trend indicator, and threshold alerts for [conditions]." | Update frequency, alert thresholds |
| Trend Charts | "Create line chart comparing [variables] over [timeframe]. Include: moving average, forecast for next [period], and annotations for [significant events]." | Time granularity, forecast method |
| Comparison Views | "Build comparison visualization for [categories] across [dimensions]. Use [chart type] optimized for spotting performance gaps and ranking [entities]." | Number of categories, sorting logic |
| Distribution Plots | "Visualize distribution of [variable] segmented by [category]. Show percentiles, median, and outliers. Optimize for identifying [specific pattern]." | Sample size, segmentation value |
When creating interactive dashboards, Excel consulting services can help implement advanced visualization techniques that complement AI-generated designs.
Annotation and Storytelling
"Generate narrative annotations for this sales trend chart showing [describe pattern]. Create 3-4 callout texts that: highlight the most significant changes, provide context for anomalies on [dates], compare current performance to targets, and suggest implications for [business area]. Write for executive audience in 15 words or less per annotation."
This approach transforms raw visualizations into guided analytical narratives that drive decision-making.
Advanced Formula and Calculation Prompts
Complex calculations often require nested functions that are difficult to construct correctly. Detailed prompts can generate sophisticated Excel formulas that would otherwise require extensive testing.
Conditional Logic Formulas
"Create an Excel formula for column [name] that calculates [metric] with these conditions: If [condition 1], then [action 1]. If [condition 2] AND [condition 3], then [action 2]. Otherwise [default action]. Handle errors by returning [error value]. Make formula dynamic to copy down [number] rows."
Breaking down logical requirements systematically ensures the AI understands all edge cases and produces robust formulas.
Array and Lookup Operations
When working with data across multiple sheets or tables, lookup functions become essential. For complex scenarios, try:
"I need to retrieve [data point] from [source table] based on matching [key column 1] AND [key column 2] with current row values. If no exact match exists, return the closest match where [criterion]. Provide formula using INDEX-MATCH or XLOOKUP that handles multiple criteria and approximate matches."
Understanding how VLOOKUP functions work provides foundational knowledge that helps you validate AI-generated lookup formulas.
Time-Based Calculations
- "Calculate rolling 12-month average for column [name] that adjusts automatically as new data is added. Include error handling for periods with less than 12 months of data."
- "Create formula to determine business days between [date column A] and [date column B], excluding holidays in range [holiday list location] and weekends."
- "Build year-over-year growth calculation that handles missing periods gracefully and flags periods where comparison data doesn't exist."
SQL and Database Query Prompts
Many data analysts work with databases before importing to Excel. AI can generate optimized queries that extract exactly the data you need.
Query Construction
"Write SQL query to extract [specific columns] from table [name] where [conditions]. Join with table [name 2] on [key field]. Group results by [dimension] and calculate [aggregations]. Filter to show only records where [having clause]. Order by [sort criteria]. Optimize for performance on dataset with [size] records."
The collection of ready-to-use AI prompts for data analysts includes numerous SQL examples that can be adapted to your specific database structure.
Data Extraction Specifications
Provide schema information for better results:
- Table structure: Column names, data types, relationships
- Business logic: Calculation rules, filtering criteria, date ranges
- Performance needs: Expected row count, acceptable query time
- Output format: Column order, naming conventions, aggregation level
"Given these tables: [describe schema], write query to generate monthly sales report showing [specific metrics] broken down by [dimensions]. Include filters for active products only (status='A') and exclude test accounts (account_type!='TEST'). Format date as YYYY-MM and round monetary values to 2 decimals."

Stakeholder Communication Prompts
Presenting findings to non-technical audiences requires translating technical analysis into business language. AI can help craft these translations effectively.
Executive Summary Generation
"Summarize these analysis results: [paste findings] into a 150-word executive summary for C-level audience. Focus on: key business impact, recommended actions, expected outcomes from implementation. Avoid technical jargon. Include one compelling data point that illustrates the main finding. Use active voice and action-oriented language."
This prompt ensures your message resonates with decision-makers who need bottom-line clarity.
Email Report Templates
"Draft email to stakeholders presenting [analysis type] results. Structure: brief context statement (2 sentences), three key findings with supporting metrics, recommended next steps, and call-to-action. Tone: professional but conversational. Attach reference to detailed methodology. Keep under 200 words."
Presentation Slide Content
Create slide-ready content with:
- "Write slide title and 3-4 bullet points explaining why [metric] decreased [percentage]. Each bullet should state one factor, supporting data point, and business implication. Maximum 12 words per bullet."
- "Generate talking points for chart showing [description]. Include: what the chart shows, why it matters, surprising finding, and recommended action. Format as speaker notes (50 words)."
Automation and Workflow Prompts
Streamlining repetitive tasks through automation multiplies your analytical capacity. AI can design workflows and generate automation scripts.
Process Documentation
"Document step-by-step process for [analytical task] including: data sources and extraction method, cleaning procedures with specific tools/formulas, analysis techniques applied, quality checks performed, output format and delivery. Write for team member with intermediate Excel skills. Include screenshots descriptions and common troubleshooting tips."
Macro and Script Generation
"Create VBA macro for Excel that: 1) Imports data from [source], 2) Applies cleaning steps [list specific operations], 3) Generates pivot table summarizing [dimensions and metrics], 4) Creates chart [specifications], 5) Emails result to [recipients]. Include error handling and user prompts for file selection."
Before implementing macros, ensure you understand how to activate macros properly to avoid security warnings and execution failures.
Workflow Optimization
- Identify repetitive tasks: List all recurring analytical processes
- Map current steps: Document time spent and pain points
- Define automation scope: Determine what can be automated vs. requires judgment
- Request optimization: "Analyze this workflow [describe current process]. Suggest automation opportunities, tools needed, and estimated time savings."
Quality Assurance and Validation Prompts
AI-generated analysis requires verification to ensure accuracy and reliability. Build validation into your prompting strategy.
Cross-Validation Requests
"Verify these analysis results using alternative method: Original approach was [describe]. Calculate same [metric] using [different technique]. Compare results and explain any discrepancies. If difference exceeds [threshold]%, investigate and identify root cause."
Research on how analysts verify AI-assisted analyses emphasizes the importance of validation protocols in maintaining analytical integrity.
Assumption Testing
Check the foundations of your analysis:
- "List all assumptions underlying this [analysis type]. For each assumption, suggest a test to validate it holds true for this dataset. Provide Excel formulas or statistical tests to verify each assumption."
- "Perform sensitivity analysis on [model/calculation]. Vary [input parameters] by ±[percentage] and show impact on [output metric]. Identify which inputs have the greatest influence on results."
Error Detection
"Review this formula: [paste formula]. Check for: logical errors, circular references, incorrect cell ranges, missing error handling, edge cases that might break the formula. Suggest improvements and provide corrected version with explanation of changes."
When working with complex workbooks, knowing how to identify duplicate values efficiently helps validate that your data cleaning prompts worked correctly.
Industry-Specific Analytical Prompts
Different sectors have unique analytical requirements. Customize prompts to your industry context for more relevant outputs.
Financial Analysis
"Analyze this P&L statement [paste data]. Calculate: gross margin, operating margin, net margin by period. Identify expense categories growing faster than revenue. Compare ratios to industry benchmarks [provide if available]. Flag items requiring management attention with variance exceeding [threshold]%."
Sales Performance
"Evaluate sales team performance using [metrics]. Rank representatives by [criteria]. Identify top performers' common characteristics. Calculate quota attainment rates and pipeline conversion ratios. Suggest coaching priorities for bottom quartile based on metric patterns."
Operations and Inventory
"Analyze inventory turnover for [product categories]. Calculate: days on hand, stockout frequency, carrying costs. Identify slow-moving items (turnover < [threshold]) and recommend reduction targets. Project optimal reorder points using [demand pattern] and [lead time]."
Combining Multiple Prompt Types for Complete Analysis
The most powerful analytical workflows chain multiple prompts together, with each step building on previous results. The best AI prompts for data analysts often involve sequential operations.
Sequential Analysis Framework
- Data assessment: "Analyze data quality and structure"
- Cleaning execution: "Apply recommended cleaning procedures"
- Exploratory analysis: "Identify patterns and relationships"
- Hypothesis testing: "Validate preliminary findings statistically"
- Visualization: "Create charts communicating key insights"
- Reporting: "Generate stakeholder summary"
Example chained prompt: "Using the cleaned dataset from previous step, perform correlation analysis between [variables]. For any correlations exceeding [threshold], create scatter plots with trend lines. Calculate R-squared values and generate interpretation suitable for business presentation. Format output as PowerPoint-ready content with chart specifications and talking points."
Iterative Refinement
Start broad, then narrow focus based on findings:
- Initial: "What are the main drivers of [outcome variable]?"
- Refinement: "Analyze [specific driver identified] across [segments]. Control for [confounding factors]."
- Deep dive: "For [highest impact segment], build predictive model forecasting [outcome] using [driver variables]. Provide equation and interpretation."
This iterative approach, supported by comprehensive prompt libraries, mirrors how experienced analysts naturally explore data.
Prompt Optimization Techniques
Improving your prompts over time increases output quality and reduces revision cycles. Apply these refinement strategies.
Specificity Over Generality
Compare these prompt pairs:
| Weak Prompt | Strong Prompt | Why It's Better |
|---|---|---|
| "Analyze sales data" | "Calculate month-over-month sales growth by region for Q1 2026. Identify regions exceeding 10% growth and those declining. Format as table with growth rates and absolute values." | Specifies time period, metric, segmentation, threshold, and format |
| "Clean my data" | "Remove duplicates from columns A-E keeping first occurrence. Standardize phone numbers to (XXX) XXX-XXXX format. Flag rows with missing values in required fields: Name, Email, Purchase Date." | Lists specific operations, criteria, and required fields |
| "Make a chart" | "Create clustered column chart comparing 2025 vs 2026 monthly revenue. X-axis: months. Y-axis: revenue ($). Include data labels, legend, and title 'Revenue Growth: Year-over-Year Comparison'." | Defines chart type, variables, axes, and annotations |
Template Development
Create reusable prompt templates for common tasks:
Monthly reporting template: "Generate [month] [year] performance report for [department]. Compare actual vs. budget for [metrics list]. Calculate variances and variance %. Identify items exceeding [threshold]% variance. Provide brief commentary explaining major variances. Format as executive dashboard with KPI cards and trend charts."
Customize the bracketed sections while maintaining proven structure.
Feedback Loops
When AI output isn't quite right:
- Identify gap: What specifically is wrong or missing?
- Clarify requirement: Add detail addressing the gap
- Provide example: Show desired output format
- Iterate: "Revise previous analysis to [specific change]"
Example: "The previous summary was too technical. Rewrite for audience with no statistics background. Replace terms like 'standard deviation' with 'typical variation.' Use everyday analogies. Keep under 100 words."
Mastering the best AI prompts for data analysts transforms how you approach spreadsheet challenges, turning hours of manual work into minutes of guided assistance. By combining specific, contextual prompts with systematic validation, you can leverage AI to clean data faster, uncover insights more thoroughly, and communicate findings more effectively. Whether you're struggling with broken formulas, messy datasets, or complex analytical requirements, The Analytics Doctor provides personalized Excel training and expert support to help you implement these AI-powered techniques and solve your toughest spreadsheet problems with clarity and confidence.