Pivot tables have long been the powerhouse of Excel data analysis, but they've traditionally required a solid understanding of data structure, field relationships, and aggregation functions. In 2026, artificial intelligence is fundamentally changing how professionals interact with this essential Excel feature. The integration of ai for excel pivot tables means analysts, finance professionals, and business users can now create sophisticated data summaries using natural language commands, automated field detection, and intelligent recommendations that would have taken hours to configure manually just a few years ago.
Understanding the AI Revolution in Pivot Table Workflows
The landscape of spreadsheet analysis has shifted dramatically with AI integration. Traditional pivot table creation required users to understand source data structure, identify appropriate rows and columns, select aggregation methods, and troubleshoot calculation errors. Modern ai for excel pivot tables eliminates much of this complexity through intelligent automation.
Microsoft's Copilot function represents the most accessible entry point for most Excel users. Microsoft is integrating Copilot into every Excel cell, allowing users to generate summaries and analyze data through conversational prompts. This integration means you can simply describe what you want to see, and the AI constructs the appropriate pivot table structure.
Beyond Microsoft's native tools, specialized platforms offer enhanced capabilities. Energent.ai provides AI-powered pivot tables that deliver instant data summarization without requiring any coding knowledge. These third-party solutions often provide more flexibility for complex analytical scenarios.
Key Benefits of AI-Enhanced Pivot Tables
- Dramatic time reduction in creating complex summaries
- Automatic field detection and relationship mapping
- Natural language querying instead of manual configuration
- Error prevention through intelligent validation
- Dynamic recommendations based on data patterns
The practical implications extend beyond simple convenience. When you're working with sales data across multiple regions, products, and time periods, ai for excel pivot tables can instantly identify the most relevant dimensions for analysis rather than requiring you to manually test different configurations.
Setting Up Your Data for AI-Powered Analysis
Successful implementation of ai for excel pivot tables begins with proper data structure. AI tools work best when your source data follows fundamental organizational principles that enable accurate interpretation.
Your dataset should be organized as a proper table with clear headers in the first row. Each column represents a single variable, and each row contains one complete record. Avoid merged cells, subtotals within your data range, or blank columns that can confuse AI interpretation algorithms.
| Data Structure Element | Best Practice | Why It Matters |
|---|---|---|
| Headers | Single row, descriptive names | AI uses headers to understand field purpose |
| Data types | Consistent within columns | Enables accurate aggregation recommendations |
| Blank cells | Minimize or use consistent placeholders | Prevents calculation errors |
| Formatting | Simple, no merged cells | Allows proper field identification |
Converting your data range into a formatted Excel table (Insert > Table) provides additional advantages. Named tables give AI tools clearer context about data boundaries and relationships. This simple step significantly improves the accuracy of automated pivot table suggestions.
Preparing Complex Datasets
When working with multiple data sources that need to be combined before pivot analysis, AI tools excel at relationship detection. If you're pulling customer data, transaction records, and product information from separate tables, modern ai for excel pivot tables can identify join keys and suggest appropriate relationships.
The Analytics Doctor’s approach to building pivot tables emphasizes clean source data as the foundation. Before deploying any AI assistance, verify that your data contains no duplicate headers, consistent date formatting, and appropriate data types for numerical fields.
Creating Pivot Tables Through Natural Language Commands
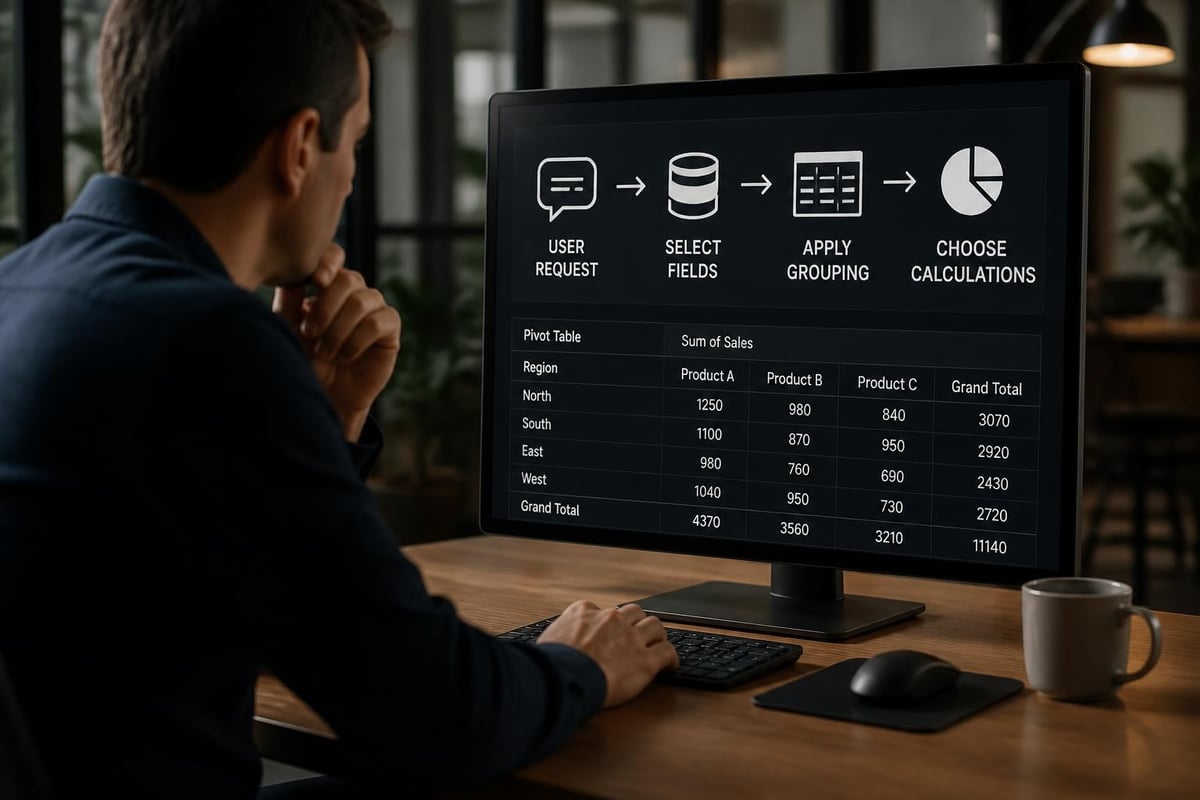
The most transformative aspect of ai for excel pivot tables is conversational interaction. Instead of navigating through the PivotTable Fields pane and dragging fields to different areas, you can describe your analytical needs in plain English.
Consider a sales dataset with columns for Date, Region, Product Category, Sales Rep, and Revenue. Traditional pivot table creation requires:
- Selecting your data range
- Inserting a pivot table
- Dragging fields to Rows, Columns, and Values areas
- Selecting appropriate aggregation functions
- Formatting the results
With AI-powered tools, you simply state: "Show me total revenue by region and product category for Q2 2026." The system interprets this request, identifies relevant fields, applies date filtering, and structures the pivot table accordingly.
Refining Results Through Iterative Prompts
The real power emerges when you refine analyses through follow-up commands. After generating the initial pivot table, you might request: "Add sales rep as a row field" or "Change the calculation to show percentage of total revenue."
Excel’s Agent Mode can fix broken formulas and enhance data analysis workflows, making it particularly valuable when your pivot table calculations aren't producing expected results. The AI can diagnose issues with field placement, aggregation methods, or filter conflicts.
Common natural language commands that work effectively:
- "Group dates by month instead of individual days"
- "Show only products with revenue above $50,000"
- "Calculate the year-over-year growth rate"
- "Sort regions by total revenue descending"
- "Add a calculated field for profit margin"
These conversational approaches dramatically reduce the learning curve for users who find traditional pivot table interfaces intimidating. For those exploring how to automate Excel tasks with AI, pivot table automation represents one of the highest-value applications.

Leveraging Microsoft Copilot for Advanced Pivot Operations
Microsoft Copilot in Excel has evolved into a comprehensive analysis assistant that extends far beyond basic pivot table creation. As of 2026, Copilot can handle complex analytical scenarios that previously required VBA programming or Power Query expertise.
When you activate Copilot within an Excel workbook containing structured data, the AI analyzes your dataset and proactively suggests relevant analyses. If your data contains time-series information, Copilot might recommend trend analysis through pivot tables with calculated fields for period-over-period comparisons.
Understanding Copilot's Capabilities and Limitations
While powerful, it's important to understand the boundaries of ai for excel pivot tables through Copilot. Microsoft launched the Copilot AI function but warns against using it for tasks requiring absolute accuracy or reproducibility. This caveat applies particularly to financial reconciliations or regulatory reporting.
For exploratory analysis, trend identification, and initial data investigation, Copilot excels. The AI can rapidly test multiple pivot table configurations to surface patterns that might not be immediately obvious. However, critical business decisions should be validated by reviewing the underlying pivot table structure and formulas.
The Copilot for Excel data analysis guide provides detailed workflows for maximizing value while maintaining appropriate oversight. Key recommendations include:
- Always review the fields Copilot selects for your pivot table
- Verify aggregation functions match your analytical intent
- Test results against known data subsets
- Document the prompts that generated specific analyses
- Maintain manual verification for mission-critical calculations
Integrating Alternative AI Platforms for Pivot Analysis
While Microsoft Copilot dominates the native Excel experience, alternative AI platforms offer compelling capabilities for pivot table creation and analysis. These tools operate either through API integration or by analyzing uploaded Excel files.
Claude, Gemini, and ChatGPT can all assist with pivot table strategy and formula generation. When working with these platforms, you typically describe your dataset structure and analytical objectives, then receive step-by-step instructions for manual implementation or formula code you can paste into Excel.
For instance, when using Claude for Excel data analysis, you might upload a sample of your data and request: "Design a pivot table structure that shows customer lifetime value segmented by acquisition channel and customer tier." Claude can outline the exact field placement, recommended calculated fields, and formatting suggestions.
Comparing AI Platform Approaches
| Platform | Strengths for Pivot Tables | Best Use Cases |
|---|---|---|
| Copilot | Native integration, direct manipulation | Real-time analysis within Excel |
| Claude | Detailed explanations, formula generation | Learning complex pivot techniques |
| Gemini | Pattern recognition, analytical suggestions | Exploratory analysis planning |
| Energent.ai | No-code automation, instant summaries | Non-technical users, rapid insights |
The comparison between Gemini and Copilot for Excel highlights how external AI platforms offer advantages in explaining why certain pivot table structures work better than others. This educational component helps users develop deeper understanding rather than simply relying on automated outputs.
For teams that need to standardize pivot table reporting across multiple workbooks, ai for excel pivot tables through platforms like Energent.ai can establish consistent templates and automated refresh schedules that update as source data changes.
Troubleshooting Common AI Pivot Table Challenges
Despite significant advances, ai for excel pivot tables still encounters limitations that require human intervention. Understanding common failure modes helps you work more effectively with AI assistance.
Field misidentification represents the most frequent issue. When column headers are ambiguous or inconsistent, AI tools may place fields in inappropriate pivot table areas. A column labeled "Total" might be interpreted as a value to sum rather than a category identifier. Clear, descriptive headers prevent this confusion.
Date handling poses another challenge. Excel stores dates as serial numbers, and AI systems sometimes struggle to determine whether a date field should be grouped by day, month, quarter, or year. Explicitly stating your desired grouping level in natural language prompts eliminates ambiguity.
Resolving Calculation Discrepancies
When ai for excel pivot tables produces unexpected numerical results, systematically verify:
- Aggregation function selection – Confirm the AI chose SUM vs. AVERAGE vs. COUNT appropriately
- Filter application – Check for inadvertent filters excluding data
- Blank cell handling – Verify how empty values are treated in calculations
- Data type consistency – Ensure text numbers aren't excluded from numerical aggregations
- Duplicate records – Confirm source data doesn't contain unintended duplicates
The best AI tool for Excel automation often depends on your specific use case. For pivot table generation with extensive error checking, dedicated platforms may outperform general-purpose AI assistants.
When working with complex calculated fields in pivot tables, AI suggestions may produce syntactically correct but logically flawed formulas. For instance, calculating profit margin requires dividing profit by revenue at the correct aggregation level. AI might suggest dividing summed profit by summed revenue rather than computing margin for each record before aggregation.

Automating Pivot Table Refresh and Distribution
Beyond initial creation, ai for excel pivot tables extends into automation of refresh cycles and report distribution. Modern AI tools can establish scheduled updates that rebuild pivot tables as underlying data changes, ensuring stakeholders always see current information.
Microsoft Power Automate integrates with Copilot-enabled Excel workbooks to trigger pivot table refresh when specific conditions occur. For example, when a new month's sales data is appended to your source table, automation can refresh all dependent pivot tables, format them according to specifications, and distribute PDF reports to designated recipients.
Building Self-Maintaining Analytical Workflows
The combination of AI-generated pivot tables and automated workflows creates self-maintaining reporting systems. Consider a financial reporting scenario where:
- Transaction data flows into Excel from your accounting system
- AI-powered pivot tables summarize expenses by department and category
- Variances from budget are automatically calculated
- Reports refresh nightly and email to department managers
- Exception alerts trigger when spending exceeds thresholds
This level of automation was previously available only through custom VBA development or dedicated business intelligence platforms. The democratization through ai for excel pivot tables puts sophisticated automation within reach of non-programmers.
Resources like the guide to automating Excel reports with Copilot detail specific implementation steps for common scenarios. Key considerations include establishing data refresh dependencies, handling errors when source data is malformed, and maintaining audit trails of automated changes.
Advanced Techniques: Calculated Fields and Custom Aggregations
While ai for excel pivot tables excels at standard summarization, advanced analytical needs often require calculated fields and custom aggregations. AI assistance extends into these sophisticated applications, though with varying degrees of success depending on complexity.
Calculated fields perform operations on existing pivot table values. Common examples include profit margins, variance percentages, or index calculations. When requesting calculated fields through natural language, specificity matters significantly.
Instead of: "Add a margin calculation"
Use: "Create a calculated field called Profit Margin that divides the Profit field by the Revenue field and formats as a percentage"
The more precise your prompt, the more accurate the AI implementation. For calculations involving multiple steps or conditional logic, breaking the request into components often yields better results.
Custom Aggregation Functions
Beyond standard SUM, AVERAGE, and COUNT functions, pivot tables support custom aggregations like DISTINCT COUNT, MEDIAN, or MODE. Not all AI tools recognize these advanced functions equally well.
When working with customer analysis requiring unique customer counts rather than transaction counts, explicitly request: "Show distinct count of Customer ID rather than total count." This precision ensures the AI selects the appropriate aggregation method.
The best AI for Excel formulas typically handles standard calculated fields effectively but may struggle with complex nested calculations or references to cells outside the pivot table structure.
Advanced calculation scenarios that benefit from AI assistance:
- Year-over-year growth percentages requiring data from multiple time periods
- Contribution percentages showing each item's share of total
- Running totals that accumulate across sorted dimensions
- Conditional calculations that apply different logic based on field values
- Index numbers benchmarking performance against baseline periods
For these complex requirements, an iterative approach works best. Start with a simple version of the calculated field, verify it produces correct results, then progressively add complexity through refinement prompts.
Industry-Specific Applications and Use Cases
The versatility of ai for excel pivot tables spans countless industries, each with distinct analytical requirements. Understanding how different sectors leverage this technology provides practical implementation ideas.
Financial services organizations use AI-enhanced pivot tables for portfolio analysis, breaking down investment performance by asset class, geography, and time period. Calculated fields show risk-adjusted returns and benchmark comparisons. The ability to rapidly restructure analyses as market conditions change provides significant competitive advantage.
In healthcare analytics, pivot tables summarize patient outcomes, treatment costs, and resource utilization. AI assistance helps clinical analysts without deep Excel expertise create sophisticated summaries that inform operational decisions. Privacy-sensitive environments benefit from AI tools that work on-premise rather than uploading data to cloud services.
Retail operations leverage ai for excel pivot tables to analyze sales patterns across stores, products, and seasons. Inventory managers use automated pivot refreshes to identify slow-moving stock, while merchandising teams track category performance trends. The combination of AI-generated insights and human business judgment optimizes buying decisions.
Manufacturing and Supply Chain Applications
Manufacturing environments generate vast datasets from production lines, quality control, and maintenance activities. AI-powered pivot analysis quickly identifies efficiency bottlenecks, defect patterns, and equipment performance trends.
Supply chain professionals use pivot tables to analyze supplier performance, shipping times, and cost variations. When dealing with thousands of SKUs across multiple distribution centers, ai for excel pivot tables dramatically accelerates the identification of optimization opportunities.
The construction estimating spreadsheet use case demonstrates how specialized industries adapt general-purpose AI tools to domain-specific requirements. Construction firms analyze project costs, labor productivity, and material usage through custom pivot table configurations that AI helps maintain.
Data Security and Privacy Considerations
As ai for excel pivot tables becomes more prevalent, security and privacy concerns require careful attention. Different AI platforms handle data differently, with significant implications for sensitive information.
Microsoft Copilot processes data within your organization's Microsoft 365 environment when properly configured. Enterprise agreements can specify data residency and processing restrictions. However, consumer versions may process queries through cloud services without the same protections.
Third-party AI platforms typically require uploading data or connecting via APIs. Before using these services with confidential information, verify:
- Where data is processed and stored
- How long the platform retains your information
- Whether your data trains broader AI models
- Compliance with relevant regulations (GDPR, HIPAA, etc.)
- Encryption standards for data in transit and at rest
Anonymization Strategies
When using external AI services, anonymizing sensitive data before upload mitigates risk. Replace actual customer names with generic identifiers, obscure precise financial figures by using percentages or indexes, and remove any personally identifiable information unnecessary for analytical purposes.
For organizations with strict data governance requirements, on-premise AI solutions or privacy-focused platforms provide necessary control. The Claude spreadsheet analysis guide includes protocols for working with sensitive data through AI assistance while maintaining appropriate security boundaries.
Future Developments in AI Pivot Table Technology
The trajectory of ai for excel pivot tables points toward increasingly sophisticated capabilities emerging through 2026 and beyond. Current research and development efforts focus on several promising directions.
Predictive pivot tables represent one frontier. Rather than simply summarizing historical data, AI-enhanced pivot tables will forecast future values based on detected patterns. A sales pivot table might not only show Q1 2026 revenue but project Q2 performance based on pipeline data and historical seasonality.
Enhanced natural language understanding will enable more nuanced analytical requests. Future systems will interpret context more effectively, understanding that "show me problem areas" should highlight negative variances, declining trends, or anomalous patterns without requiring explicit definition of "problem."
Cross-workbook analysis through AI coordination will allow pivot tables that automatically incorporate data from multiple files. Instead of manually consolidating monthly reports, AI will identify relevant data sources, align structures, and create unified analyses.
Integration with Advanced Analytics
The boundary between pivot tables and advanced statistical analysis will blur as AI brings sophisticated techniques into accessible formats. Regression analysis, clustering, and anomaly detection will become available through natural language requests within the familiar pivot table interface.
Research papers like PiLLar’s framework for matching pivot table schemas demonstrate academic efforts to solve complex data integration challenges. As these innovations transition from research to commercial implementation, ai for excel pivot tables will handle increasingly complex analytical scenarios.
The democratization of data analysis continues accelerating. Features currently requiring data science expertise will become available to general business users through conversational AI interfaces that generate appropriate analytical structures automatically.
The integration of AI into Excel pivot table workflows represents a fundamental shift in how professionals interact with data analysis tools. By reducing technical barriers, accelerating creation time, and enabling more sophisticated analyses, ai for excel pivot tables empowers users at all skill levels to extract meaningful insights from complex datasets. Whether you're struggling with pivot table structure, need to automate recurring reports, or want to leverage the latest AI capabilities in your analytical workflows, The Analytics Doctor provides expert guidance, training, and hands-on support to transform your spreadsheet challenges into streamlined, intelligent solutions that drive better business decisions.