Imagine the work of spreadsheet evolving far beyond simple calculations, shaping the way organizations make decisions and find insights. In 2025, spreadsheets are not just tools—they are engines that automate tasks, boost collaboration, and drive innovation.
This essential guide reveals how the work of spreadsheet has changed, why it remains vital, and how you can master its latest features. You will discover trends, advanced techniques, automation tips, and expert advice to help you stay ahead in the modern workplace.
The Evolution of Spreadsheet Work: Past to 2025
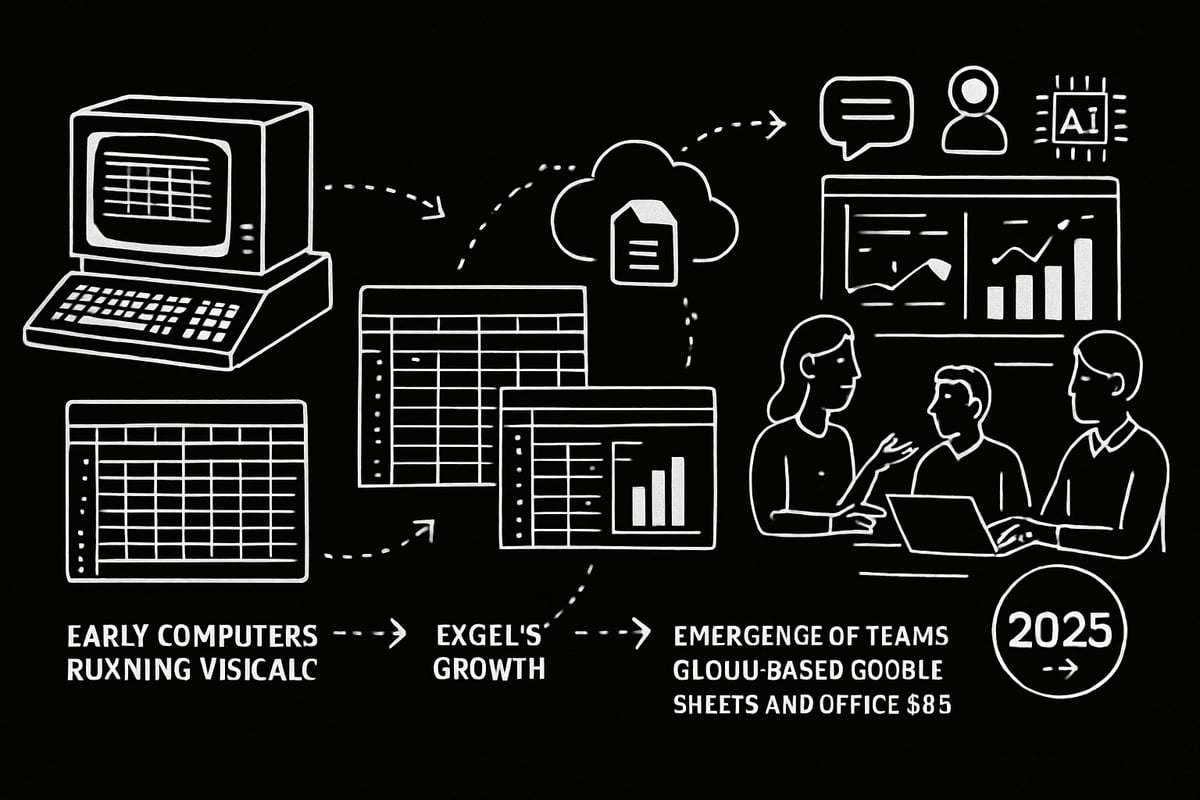
Imagine the early days of the work of spreadsheet, when VisiCalc first brought digital grids to life on personal computers. These humble beginnings in the late 1970s transformed how businesses processed numbers, quickly followed by the rise of Lotus 1 2 3 in the 1980s. The work of spreadsheet evolved rapidly as Microsoft Excel became the industry standard, introducing graphical interfaces and formula-driven automation that unlocked new possibilities.
Key Milestones in Spreadsheet History
The journey of the work of spreadsheet began with VisiCalc, a simple tool that allowed users to perform calculations without paper ledgers. Lotus 1 2 3 soon took center stage, adding charting and database capabilities, making the work of spreadsheet more interactive and accessible.
Microsoft Excel’s debut in 1985 marked a turning point. Excel introduced a user-friendly interface, advanced formulas, and charting tools, establishing itself as the backbone of business operations. Over time, spreadsheets shifted from basic calculators to platforms for complex data analysis.
A major leap came with cloud-based solutions like Google Sheets and Office 365. Now, the work of spreadsheet extended beyond single devices, enabling real-time collaboration and cross-device accessibility. Teams could edit, comment, and share insights instantly, regardless of location.
The user base exploded, with over 1 billion Excel users worldwide by 2024, according to Microsoft. Integration with business intelligence tools further empowered users to build dynamic dashboards and perform sophisticated financial modeling, moving from static reports to live, interactive data environments.
| Key Milestone | Year | Impact |
|---|---|---|
| VisiCalc Launch | 1979 | First digital spreadsheet, basic calculations |
| Lotus 1 2 3 Dominance | 1983 | Charting, database features, mass business adoption |
| Microsoft Excel Rise | 1985+ | Advanced formulas, graphical interface |
| Cloud Spreadsheets | 2006+ | Real-time collaboration, cross-device access |
| BI Integration | 2010s | Dynamic dashboards, advanced analytics |
Spreadsheets remain the backbone of countless business processes, supporting everything from budgeting to strategic decision-making. The work of spreadsheet has become indispensable, adapting seamlessly to new technologies and organizational needs.
Emerging Trends Shaping Spreadsheet Work in 2025
Looking ahead, the work of spreadsheet is undergoing another transformation. Artificial intelligence now powers data analysis, suggesting formulas and visualizations tailored to your dataset. Automation tools, such as macros and scripts, are reducing manual workloads, allowing teams to focus on high-impact tasks.
Enhanced visualization features and interactive dashboards are making insights more accessible. Spreadsheets now integrate seamlessly with databases, APIs, and other business apps, creating a connected ecosystem for data-driven decisions.
Data governance and compliance have taken center stage. Organizations prioritize secure sharing, access controls, and audit trails to ensure sensitive information stays protected. AI-driven error detection is cutting manual auditing time by up to 30 percent, helping teams maintain data integrity.
The role of the work of spreadsheet is expanding in the digital workplace, not shrinking. As highlighted in The Future of Spreadsheets in the Big Data Era, modern spreadsheets are evolving into powerful platforms for big data, automation, and real-time collaboration.
In 2025, mastering the work of spreadsheet means embracing continuous innovation. From AI-powered suggestions to seamless integration, spreadsheets are more essential than ever for driving business success.
Essential Spreadsheet Features and Tools for 2025
In 2025, the work of spreadsheet is more dynamic, powerful, and user-friendly than ever before. Modern spreadsheets are no longer just static tables. They are interactive, intelligent platforms that drive business insights, automate workflows, and support real-time collaboration.

Must-Have Functions and Capabilities
Today, mastering the work of spreadsheet means leveraging the most advanced tools at your fingertips. Key features like XLOOKUP, dynamic arrays, LET, and LAMBDA functions make data analysis faster and more accurate. With these, users can create flexible formulas that adapt to changing datasets.
Data cleaning and transformation tools are now built right into the spreadsheet environment. This means you spend less time preparing your information and more time making decisions. Pivot tables have evolved as well, offering deeper insights through multi-level grouping and advanced charting.
Conditional formatting and smart alerts let you highlight trends or anomalies instantly. For example, using dynamic arrays, you can automate monthly reporting. This reduces manual updates and ensures your reports are always up to date, making the work of spreadsheet more efficient.
Data validation and error-checking functions are crucial for maintaining accuracy. Dropdown lists, custom rules, and real-time error notifications help prevent mistakes before they impact your analysis. Built-in AI assistants now suggest formulas, spot errors, and even recommend better ways to visualize your data.
These enhancements ensure the work of spreadsheet is not just about crunching numbers, but about unlocking business value with every cell.
Leading Spreadsheet Platforms: Comparison
Choosing the right platform is essential for maximizing the work of spreadsheet in your organization. Microsoft Excel remains a powerhouse, introducing new features in 2025 such as enhanced enterprise integration and advanced automation. Google Sheets stands out for real-time collaboration, robust add-ons, and AI-powered tools.
Other contenders like Airtable, Smartsheet, and Zoho Sheet offer unique strengths. Airtable blends spreadsheet simplicity with database flexibility. Smartsheet excels in project management integrations, while Zoho Sheet focuses on strong security and compliance.
Here’s a quick comparison:
| Platform | Collaboration | AI Tools | Automation | Security & Compliance | Market Share (2024) |
|---|---|---|---|---|---|
| Excel | Moderate | Yes | Advanced | Strong | 65% |
| Google Sheets | Excellent | Yes | Good | Good | 25% |
| Airtable | Good | Some | Good | Good | 5% |
| Smartsheet | Good | Some | Good | Excellent | 3% |
| Zoho Sheet | Good | Some | Moderate | Excellent | 2% |
Security features like encryption, multi-factor authentication, and detailed permission controls are now standard. Compliance with regulations such as GDPR and HIPAA is a top priority, especially as spreadsheets become more central to business operations.
For an in-depth look at the differences between popular platforms, see this Comparison of spreadsheet software.
Selecting the right tool ensures your team can fully harness the work of spreadsheet for every project.
Advanced Techniques for Power Users
Unlocking the full work of spreadsheet potential means going beyond the basics. Power users are transforming how data is managed, reported, and secured in 2025. With a focus on automation, advanced analytics, and bulletproof error management, these techniques offer a competitive edge for anyone ready to elevate their spreadsheet game.

Data Automation and Workflow Optimization
Modern professionals are revolutionizing the work of spreadsheet by automating repetitive tasks and integrating with other business systems. Using tools like macros, Power Query, and scripts, you can schedule data refreshes, generate reports, and eliminate manual labor.
Common automation methods include:
- Recording macros for daily operations
- Using Power Query to clean and transform data
- Scripting with VBA, Python, or Google Apps Script for custom workflows
- Integrating with Zapier or Power Automate to connect spreadsheets with CRMs, email, and databases
For example, automating monthly sales reports can save over 10 hours per month. This not only streamlines the work of spreadsheet, it also reduces errors and frees up time for deeper analysis. Imagine setting up a script to pull data from your accounting platform and automatically update your dashboard each morning.
If you're ready to dive deeper, check out this guide on Automating Excel spreadsheets to discover practical workflows and setup tips.
Power Pivot is another game-changer for handling large datasets, allowing for real-time analytics and simplified data modeling. By connecting your spreadsheet to live data sources, you can automate data pipelines and focus on decision-making instead of data entry.
Data Analysis and Visualization Mastery
The work of spreadsheet is now synonymous with powerful, interactive data analysis. Power users leverage advanced functions and visualization tools to unlock actionable insights.
Key techniques include:
- Building interactive dashboards with slicers, dynamic charts, and filters
- Creating multi-dimensional pivot tables for granular analysis
- Using statistical functions like FORECAST, TREND, and LINEST for predictive analytics
Try structuring your data model to enable easy relationships between tables. This makes it possible to analyze sales by region, product, or time period with just a few clicks. For example, a real-time KPI dashboard can be built using dynamic arrays, conditional formatting, and linked visualizations to highlight trends as they happen.
Here's a quick example of a dynamic formula using Excel's new functions:
=FILTER(SalesData, SalesData[Region]="West")
This pulls all sales for the West region, updating instantly as your data changes.
Mastering these techniques elevates the work of spreadsheet from static tables to living business intelligence platforms. By staying current with new visualization features, you ensure your reports are both informative and visually engaging.
Protecting Data Integrity and Managing Errors
Ensuring the accuracy of your work of spreadsheet is essential as spreadsheets become central to business operations. Power users employ a range of strategies to minimize errors and maintain data integrity.
Best practices include:
- Using data validation to restrict inputs and prevent entry mistakes
- Applying conditional formatting for instant error highlighting
- Creating dropdown lists to standardize entries
Auditing tools such as Trace Precedents, Error Checking, and Version History are invaluable for tracking changes and identifying issues. For instance, setting up data validation rules can dramatically reduce the risk of costly mistakes.
Consider this simple validation rule:
=AND(ISNUMBER(A2), A2>0)
This ensures only positive numbers are entered in cell A2, protecting your calculations from invalid data.
Regular audits and clear documentation help keep the work of spreadsheet reliable and trustworthy. By establishing a maintenance schedule, you can proactively address errors before they impact your business.
Collaboration, Sharing, and Security in Modern Spreadsheets
The work of spreadsheet has evolved rapidly, transforming how teams connect, share, and protect business-critical data. As organizations rely on spreadsheets for everything from budgeting to analytics, the need for seamless collaboration and robust security has never been greater.

Evolving Collaboration Tools and Practices
Modern spreadsheet platforms have revolutionized teamwork. Real-time co-authoring lets multiple users edit the same file at once, eliminating version chaos and delays. Colleagues can comment, tag teammates, and resolve questions directly inside the sheet, making feedback quick and transparent.
Version control ensures that every change is tracked. You can roll back to earlier versions, compare edits, or audit who did what and when. Secure sharing tools offer granular control, so you set permissions for view, comment, or edit access. Link expiration and access logs add further protection.
Teams increasingly integrate spreadsheets with project management tools like Asana and Trello. This blend keeps workflows connected, so updates in one tool reflect immediately in the other. Distributed teams, especially remote ones, depend on cloud-based spreadsheets. In fact, 80% of remote teams now rely on these platforms for daily collaboration.
Here’s a quick table highlighting key collaboration features:
| Feature | Benefit |
|---|---|
| Real-time co-authoring | Eliminates version conflicts |
| Commenting & tagging | Streamlines feedback |
| Version history | Enables easy audit and rollback |
| Secure sharing | Controls data access |
| Tool integration | Connects workflows |
These advancements mean the work of spreadsheet is no longer a solo effort. Instead, it is a central hub for collective decision-making, driving productivity across organizations.
Data Security and Compliance Essentials
With great collaboration comes a greater need for security. The work of spreadsheet often involves sensitive financial, HR, or customer data, making protection a top priority. Leading platforms now offer encryption for data at rest and in transit, keeping information safe from unauthorized access.
Multi-factor authentication adds another layer of defense, ensuring only approved users can reach confidential sheets. Organizations must also comply with regulations like GDPR and HIPAA, which demand strict control over personal and business data.
Managing user roles is key. You can assign permissions by individual or group, limiting who can view or change specific data. Audit trails provide a full record of access and changes, helping spot unusual activity or unauthorized edits. For example, using audit logs, finance teams can monitor sensitive transactions and detect anomalies quickly.
Security mistakes can be costly. Errors in spreadsheets have led to major financial and operational mishaps. In fact, research into the Impact of Errors in Operational Spreadsheets highlights just how crucial robust controls are for maintaining data integrity.
As the work of spreadsheet becomes even more central to business intelligence, organizations must prioritize compliance, role management, and proactive monitoring. The right balance of collaboration and security ensures that spreadsheets remain a trusted, high-impact tool in every workplace.
The Future of Spreadsheet Work: Automation, AI, and Beyond
The future of the work of spreadsheet is unfolding rapidly, with automation and AI redefining what’s possible. As organizations look to stay competitive in 2025 and beyond, spreadsheets are becoming smarter, more connected, and more essential than ever. Let’s explore how these advancements are shaping the next era of productivity.
AI-Driven Features Transforming Spreadsheets
Artificial intelligence is revolutionizing the work of spreadsheet by turning static documents into dynamic, intelligent tools. Modern spreadsheets now offer AI-powered formula suggestions, automated insights, and anomaly detection, saving teams countless hours on manual data review.
Imagine asking your spreadsheet to summarize trends or flag unusual patterns. Natural language queries and voice commands are making this a reality, letting users interact with data as if they’re having a conversation. Predictive analytics and machine learning are also being woven in, enabling forecasts and scenario analysis directly within the familiar spreadsheet interface.
A standout example is AI recommending the best visualization for your dataset, instantly transforming raw numbers into clear, actionable charts. With tools that suggest analytical approaches or even generate complex formulas, the work of spreadsheet is moving beyond calculation to become a true decision-making partner. For those seeking to deepen their expertise in these AI-driven capabilities, resources like Analytical spreadsheet strategies can provide targeted guidance.
Expanding the Spreadsheet Ecosystem
The work of spreadsheet is no longer confined to isolated files. Today’s platforms are hubs, integrating with third-party apps, APIs, and databases to streamline business workflows. No-code and low-code automation tools are making it easy for users to build solutions without advanced programming skills.
Seamless integration means you can automatically pull in sales data from your CRM, update inventory from your database, or trigger tasks in project management tools—all from within your spreadsheet. Automation platforms like Zapier allow you to connect spreadsheets with hundreds of services, orchestrating complex workflows with a few clicks.
For example, HR teams are building onboarding automations that use spreadsheets as the backbone, connecting forms, notifications, and databases to minimize manual tasks. As the ecosystem grows, the work of spreadsheet is evolving into a central command center for digital operations, empowering users to do more with less effort. This interconnected future means spreadsheets will continue to play a vital role in how organizations manage, analyze, and act on data.
Preparing for the Next Generation of Spreadsheet Work
With these advances, professionals must adapt to keep pace. Upskilling is crucial, as the work of spreadsheet demands not only technical know-how but also analytical thinking and automation literacy. Continuous learning and certifications help users unlock advanced features and stay ahead of industry changes.
Spreadsheet experts are increasingly recognized as key players in digital transformation initiatives. Their ability to harness new tools and guide teams through change makes them invaluable assets. Mastery of spreadsheets is no longer just about formulas—it’s about understanding how to integrate AI, automate workflows, and drive business strategy.
To future-proof your career, invest in resources that build both foundational and advanced skills. Platforms offering Spreadsheet mastery techniques deliver hands-on learning tailored for the evolving landscape. By embracing innovation and committing to lifelong learning, you ensure that your expertise in the work of spreadsheet remains a competitive advantage in 2025 and beyond.
Step-by-Step Guide: Building a High-Impact Spreadsheet in 2025
Building a high-impact spreadsheet in 2025 is about much more than just entering data. The work of spreadsheet creation now follows a structured, strategic process. Let’s break down each step so you can maximize the value you deliver.
Step 1: Define Your Objective and Plan Structure
Before you type a single cell, clarify the goal behind your work of spreadsheet. Are you tracking sales, forecasting budgets, or analyzing survey results? Identify your stakeholders and their needs.
Outline the data sources you’ll need and the outputs you want to achieve. Sketch the layout on paper or digitally, deciding what sections, tabs, or dashboards your spreadsheet should include.
Choosing the right platform is crucial. Explore different options using this list of spreadsheet software to ensure your tool matches your objectives and the scale of your project.
A clear plan sets the stage for a streamlined, effective work of spreadsheet that’s built for impact.
Step 2: Gather and Import Data
With your blueprint ready, focus on gathering reliable data. The work of spreadsheet in 2025 often starts with importing from varied sources: CSV files, databases, APIs, or direct connections to cloud services.
Modern platforms offer built-in connectors that simplify this process. Use data cleaning tools to remove duplicates, standardize formats, and handle missing values. This ensures your foundation is solid.
Remember, quality data is the backbone of any successful work of spreadsheet. Invest time here to prevent issues later.
Step 3: Build Core Calculations and Logic
Now, craft the logic that powers your solution. The work of spreadsheet shines when you leverage advanced formulas like XLOOKUP, dynamic arrays, or custom functions.
Structure calculations using named ranges and clear labels for easy scalability. Organize your formulas logically—place assumptions and constants in dedicated sections, and use comments to explain complex logic.
For large or complex tasks, modularize your calculations. This approach keeps your work of spreadsheet flexible and easy to audit as needs evolve.
Step 4: Design Interactive Dashboards and Reports
Bring your data to life with dashboards that make insights obvious. The work of spreadsheet now includes interactive charts, slicers, and filters that let users explore results in real time.
Prioritize user-friendly layouts. Use color-coded conditional formatting for quick visual cues. Group related metrics together and add clear labels.
Navigation is key. Add a home tab or menu to help users find the right view quickly. Your work of spreadsheet should be as intuitive as a well-designed website.
Step 5: Automate and Optimize Workflow
Automation is transforming the work of spreadsheet in 2025. Use macros, scripts, or built-in tools like Power Query to automate repetitive steps—such as data refreshes or report distribution.
Scheduling features let you deliver up-to-date results without manual intervention. For advanced needs, consider exploring advanced spreadsheet programming to build custom scripts or integrations.
A well-automated work of spreadsheet saves time, reduces errors, and increases value for your team.
Step 6: Collaborate and Secure Your Spreadsheet
Collaboration is at the heart of modern work of spreadsheet. Share your file with stakeholders, but manage permissions carefully to control access.
Enable version history and comment threads for transparent feedback. Use built-in security features like password protection, access logs, and role-based permissions.
Secure sharing is essential. Always review who can view or edit your work of spreadsheet, especially when handling sensitive or regulated data.
Step 7: Test, Audit, and Maintain
Testing is non-negotiable in the work of spreadsheet. Review for formula errors, broken links, and logic flaws using auditing tools.
Set up a maintenance schedule. Regularly update your data sources, review user feedback, and document key formulas and processes. This ensures your work of spreadsheet remains accurate and valuable as requirements change.
A simple testing checklist:
- Review all formulas for accuracy
- Test inputs and outputs with sample data
- Check for broken links and references
- Update documentation as needed
Practical Example: End-to-End Build for a Sales Performance Tracker
Let’s apply the work of spreadsheet principles to a real-world scenario. Imagine you’re building a sales performance tracker for a distributed team.
Start by defining the objective: track monthly sales, targets, and trends. Gather data from the CRM, import it using built-in connectors, and clean it to ensure consistency.
Build core calculations for KPIs like conversion rates and average deal size. Design an interactive dashboard with charts and slicers for region, product, and rep. Automate data refreshes weekly and schedule report emails to managers.
Collaborate by sharing the file with team leads, setting view-only permissions for executives. Test formulas, audit for errors, and document your workflow for easy handoff.
The result? A robust, automated, and collaborative work of spreadsheet that drives smarter decisions and maximizes business impact.