Spreadsheet reporting consumes hours of valuable time each week for most finance and operations teams. Between pulling data from multiple sources, cleaning inconsistencies, updating formulas, formatting charts, and distributing files, the manual effort compounds quickly. AI-powered automation offers a practical solution to eliminate repetitive tasks and accelerate report creation. Understanding how to automate Excel reporting with AI empowers professionals to reclaim time while improving accuracy and consistency across their reporting workflows.
Understanding AI Automation for Excel Reports
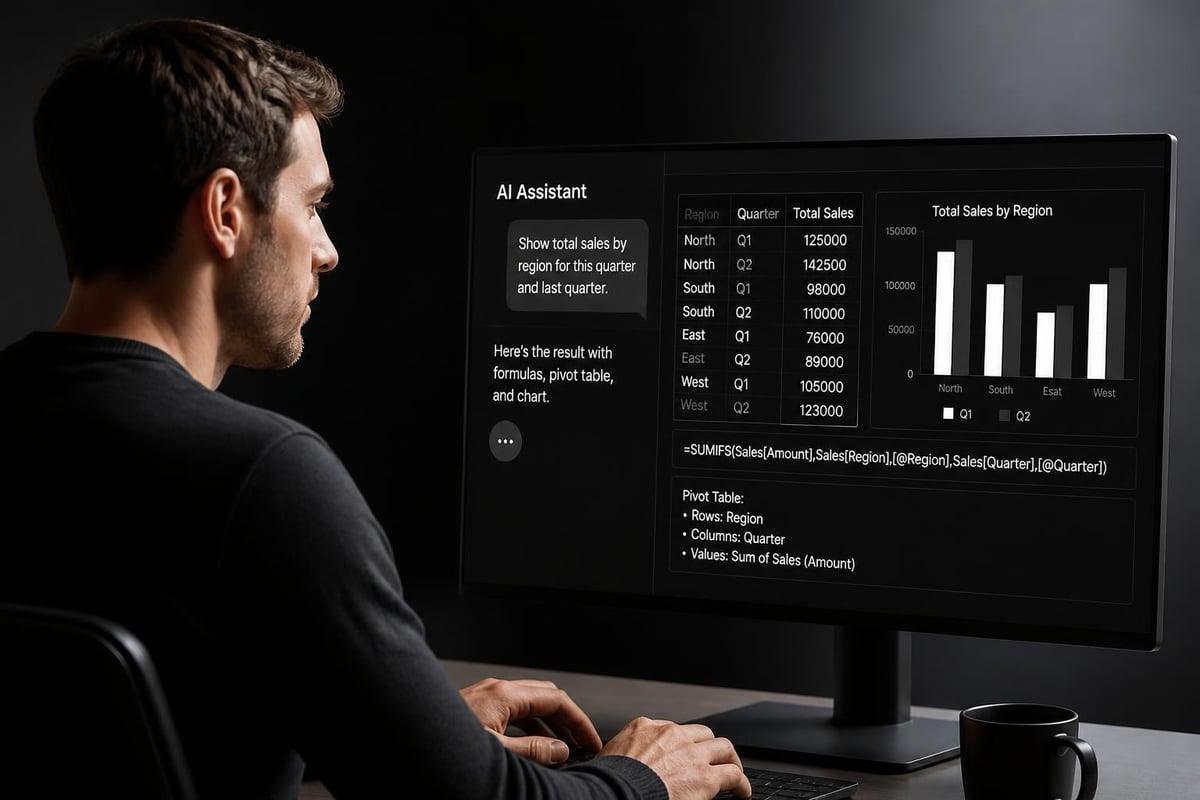
Artificial intelligence transforms traditional Excel workflows by interpreting natural language commands, generating complex formulas, identifying data patterns, and executing repetitive tasks autonomously. Modern AI systems integrate directly with Excel through add-ins, cloud platforms, or companion applications that enhance native spreadsheet capabilities.
The core advantage centers on translating business requirements into technical execution without manual intervention. Instead of spending 30 minutes building a monthly sales report, you describe what you need and let AI assemble the components.
Key AI Capabilities for Report Automation
Several distinct AI functions contribute to automated reporting:
- Natural language processing interprets your instructions and converts them into formulas, macros, or formatting rules
- Pattern recognition identifies trends, anomalies, and relationships within your datasets automatically
- Formula generation creates complex calculations based on described logic without manual syntax writing
- Data extraction pulls information from multiple sources and consolidates it into structured formats
- Scheduling automation generates and distributes reports at predetermined intervals without manual triggering
Research on AI-driven spreadsheet manipulation demonstrates how interactive agents can perform sophisticated table reasoning and data transformations. These capabilities enable Excel users to automate tasks that previously required advanced programming knowledge.
Choosing the Right AI Tools for Excel Automation
Multiple platforms and approaches exist for implementing how to automate Excel reporting with AI. Your selection depends on report complexity, data sources, team technical skills, and existing infrastructure.
Native Microsoft Solutions
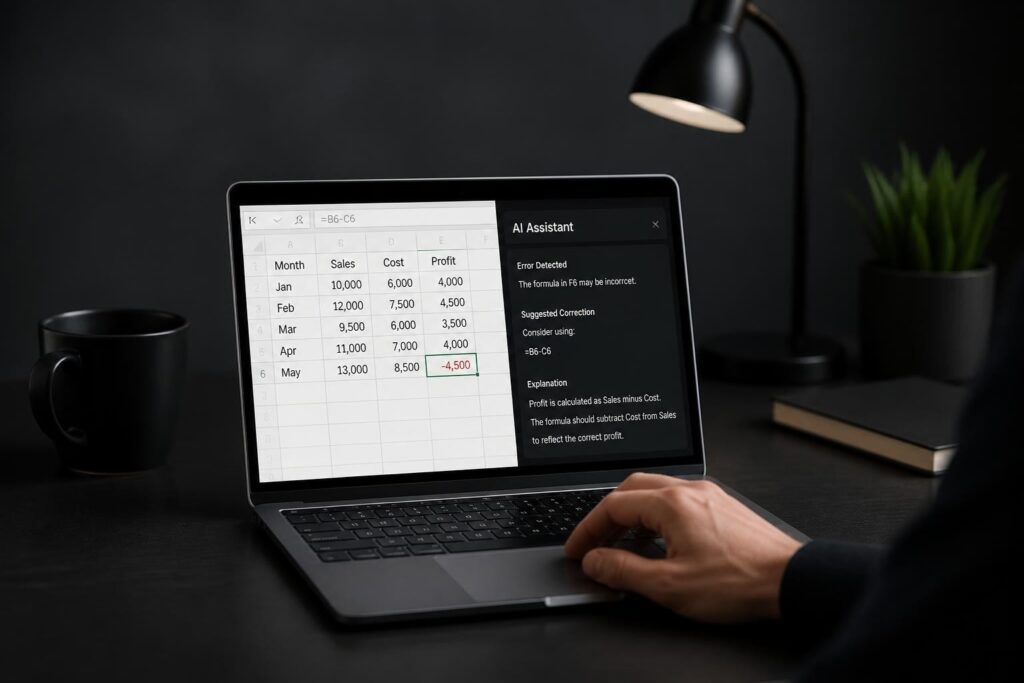
Microsoft Copilot represents the most integrated approach for Excel users. This AI assistant operates directly within Excel's interface, understanding spreadsheet context and executing commands through natural conversation. Excel’s Agent Mode can fix broken formulas and automate complex workflows without leaving your workbook.
For comprehensive guidance on leveraging this built-in capability, explore our Microsoft Copilot for Excel tutorial which covers setup, commands, and practical applications.
Third-Party AI Platforms
Specialized platforms extend beyond Excel's native capabilities with enhanced automation features:
| Platform | Primary Strength | Best For |
|---|---|---|
| Alteryx | End-to-end reporting pipelines | Enterprise data workflows |
| Ilka | Scheduled report packs from live data | Finance and operations teams |
| Sourcetable | AI-generated narratives and charts | Professional presentation reports |
| Elkar | In-spreadsheet AI analyst | Complex model building |
Ilka specifically targets Excel reporting automation for operations and finance teams by creating or improving workbooks with AI and scheduling recurring report distribution. This specialized focus makes it particularly effective for standardized monthly, weekly, or daily reporting cycles.
AI Language Models as Excel Assistants
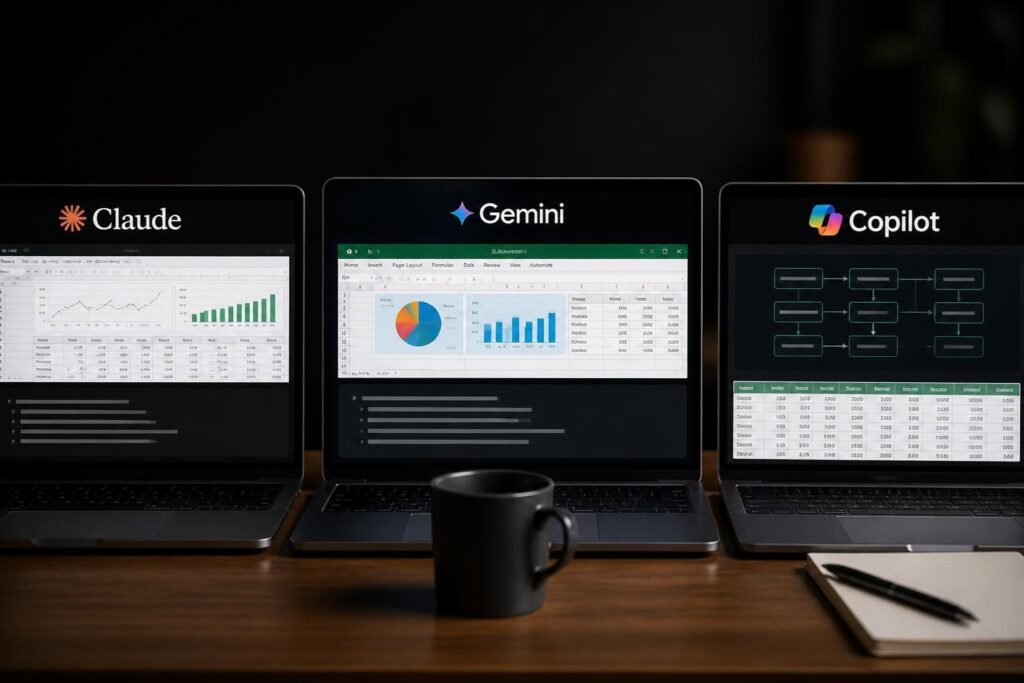
General-purpose AI assistants like Claude, Gemini, and ChatGPT provide flexible Excel support through conversational interfaces. While they don't integrate directly into Excel, they excel at generating formulas, debugging errors, and designing automation strategies.
Our Claude for Excel data analysis guide demonstrates how to leverage these conversational AI tools for spreadsheet problem-solving. The advantage lies in explaining your specific business context and receiving customized solutions.
Building Your First Automated Excel Report
Implementing automation starts with a systematic approach that breaks complex reporting processes into manageable components. This methodology applies whether you're automating a simple weekly summary or a comprehensive monthly financial package.
Step 1: Document Your Current Manual Process
Before automating, map your existing workflow completely:
- Identify every data source (databases, other Excel files, web exports, manual entries)
- List all transformations applied to raw data (cleaning, filtering, calculations)
- Catalog required outputs (tables, charts, pivot tables, summary statistics)
- Note formatting requirements and distribution methods
- Record frequency and timing requirements
This documentation becomes your automation blueprint. Most professionals discover 60-70% of their reporting steps follow identical patterns each cycle.
Step 2: Prepare Consistent Data Structures
AI automation performs best with predictable, well-organized data:
- Standardize column names across all source files using consistent terminology
- Eliminate merged cells which interfere with automated data processing
- Use Excel tables (Ctrl+T) for dynamic ranges that expand automatically
- Establish naming conventions for sheets, files, and data ranges
- Remove manual formatting from data zones to separate content from presentation
When your sales data consistently arrives with columns named "Date," "Product_ID," "Quantity," and "Revenue," AI tools can reliably process it without adjustment.
Step 3: Implement AI-Powered Data Consolidation
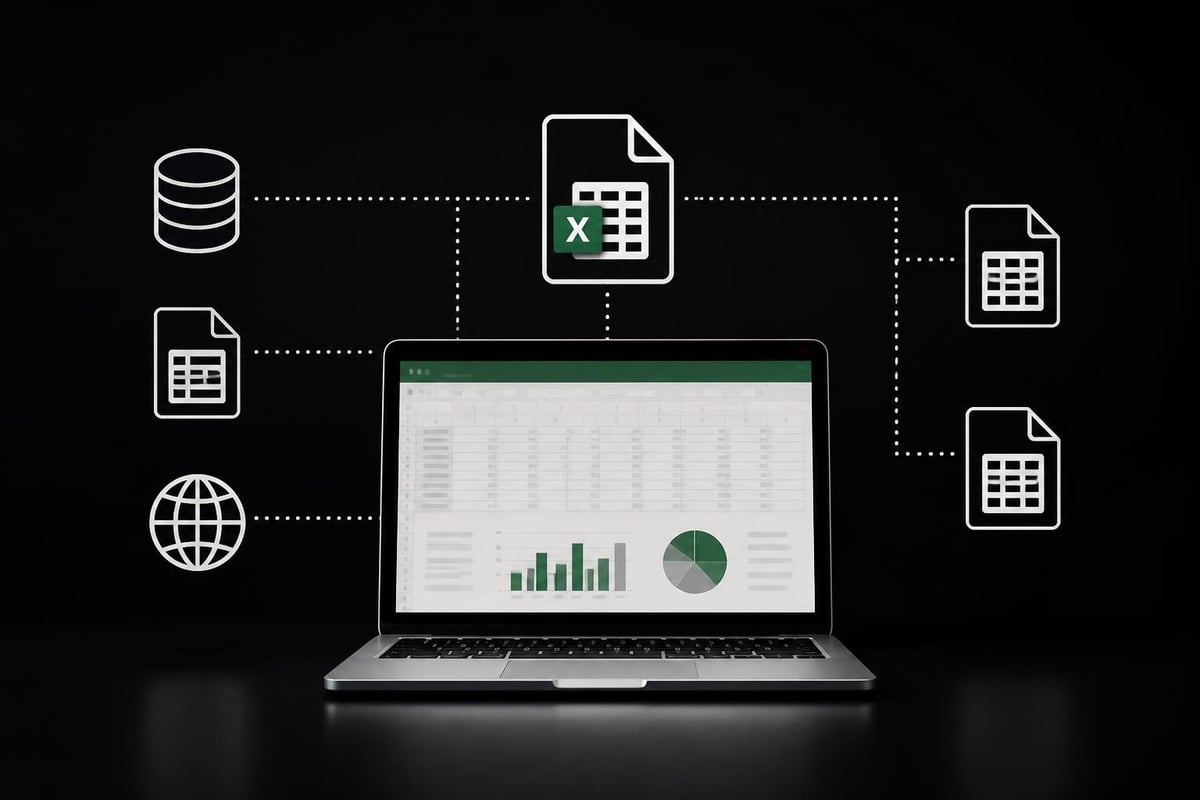
The foundation of report automation involves bringing dispersed data into a central location systematically. Automated reporting tools eliminate manual data collection by connecting directly to source systems.
For Excel-centric workflows, Power Query provides the most robust consolidation engine. You can enhance Power Query development using AI assistance:
- Ask AI to generate M code for specific transformations
- Request optimization of existing queries for better performance
- Troubleshoot errors by pasting error messages into AI chat interfaces
- Design merge and append logic for complex multi-source scenarios
If you're working with Excel task automation, Power Query combined with AI guidance creates powerful data pipelines that refresh with a single click.
Step 4: Automate Formula Creation and Calculation Logic
Manual formula writing represents a significant time investment in report preparation. AI dramatically accelerates this process through natural language formula generation.
Instead of researching syntax for complex nested formulas, describe your calculation requirement:
Your instruction: "Calculate the 3-month rolling average of revenue, but only for products in the 'Premium' category, showing zero if fewer than 3 months of data exist."
AI-generated formula: =IF(COUNTIFS(Category,"Premium",Date,">="&EOMONTH(A2,-3))>=3, AVERAGEIFS(Revenue,Category,"Premium",Date,">="&EOMONTH(A2,-3),Date,"<="&A2), 0)
Research on natural language instruction in Excel explores how AI models interpret and execute user commands to automate spreadsheet tasks. This capability eliminates the learning curve for advanced Excel functions.
For teams regularly building financial models, review our best AI for Excel formulas comparison to identify tools optimized for calculation logic.
Step 5: Configure Automated Visualization
Charts and graphs transform data into insights but require manual updating in traditional workflows. Automated reporting systems generate visualizations programmatically based on refreshed data.
Implementation approaches include:
- Dynamic chart ranges using Excel tables or named ranges that expand automatically
- AI-generated chart recommendations based on data characteristics and reporting goals
- Template-based visualization where chart types and formatting persist while data updates
- Conditional formatting rules that highlight exceptions without manual review
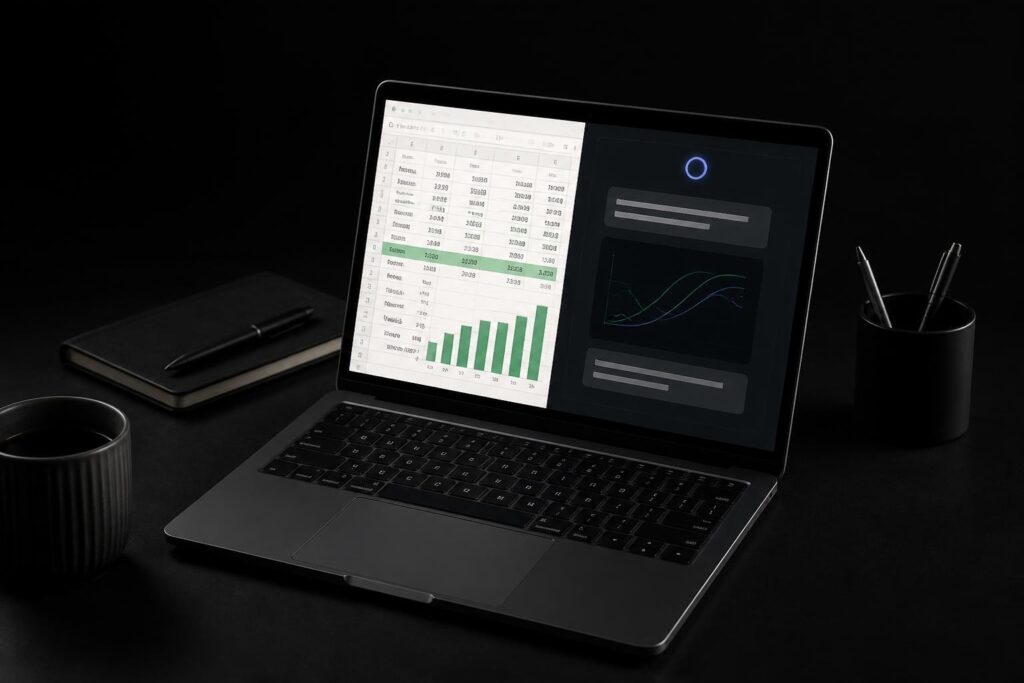
Sourcetable’s AI generates professional reports directly from spreadsheet data, auto-generating charts and building tables of contents to expedite report creation. This eliminates the manual chart design process entirely.
Step 6: Schedule and Distribute Reports Automatically
The final automation component involves timing and delivery. How to automate Excel reporting with AI extends beyond content creation to include distribution workflows.
Modern platforms offer several scheduling mechanisms:
| Method | Complexity | Requirements | Best Use Case |
|---|---|---|---|
| Excel Online automation | Low | Microsoft 365 subscription | Simple scheduled refreshes |
| Power Automate flows | Medium | Power Automate license | Email distribution with conditions |
| VBA with Task Scheduler | Medium | Desktop Excel, programming knowledge | Legacy system integration |
| Third-party platforms | Low | Platform subscription | Enterprise-grade reporting |
Alteryx’s automation platform provides comprehensive capabilities for report creation, formatting, and delivery with AI-driven summaries and visualizations. This enterprise approach suits organizations managing dozens of automated reports.
For smaller teams, combining Excel's built-in refresh capabilities with Outlook rules or simple VBA macros often provides sufficient automation without additional software investments.
Advanced Automation Techniques for Complex Reports
Once basic automation functions reliably, advanced techniques enhance sophistication and business value. These methods address scenarios where standard automation falls short.
Implementing AI-Driven Data Quality Checks
Automated reports fail when underlying data contains errors. AI-powered validation identifies anomalies before report generation:
- Outlier detection algorithms flag unusual values for review
- Pattern matching identifies formatting inconsistencies
- Cross-reference validation ensures data relationships remain intact
- Historical comparison highlights unexpected period-over-period changes
You can prompt AI assistants to generate validation formulas: "Create a formula that flags any invoice amount more than 3 standard deviations from the monthly average for that customer."
Building Self-Adjusting Report Templates
Static templates require manual modification when business requirements change. Intelligent templates adapt automatically:
Dynamic section inclusion: Reports include or exclude entire sections based on data availability. If no international sales occurred this month, that analysis section disappears automatically.
Adaptive formatting: Cell formatting, decimal places, and number formats adjust based on value magnitude. Revenue figures display in thousands, millions, or billions as appropriate.
Contextual commentary: AI-generated text summaries explain significant variances, trends, or exceptions detected in the data. Instead of just showing numbers, reports explain what changed and why it matters.
Our Excel dashboard creation with AI resource explores how to build adaptive reporting interfaces that respond intelligently to changing data.
Integrating Multiple Data Sources Seamlessly
Enterprise reporting often requires combining data from ERP systems, CRM platforms, financial databases, and external market data. AI automation excels at orchestrating these complex integrations.
Modern approaches include:
- API connections that pull live data directly from source systems
- Natural language query builders that translate business questions into database queries
- Automated data mapping between disparate schemas and structures
- Conflict resolution logic when multiple sources provide contradictory information
Research on AI-driven business intelligence requirements demonstrates how semantic search and large language models can automate specification of reporting needs, including Excel integration.

Troubleshooting Common Automation Challenges
Even well-designed automation encounters obstacles. Understanding frequent issues and their resolutions prevents frustration and maintains reporting reliability.
Handling Data Format Changes
Source systems occasionally modify export formats, breaking automated processes. Build resilience through:
- Flexible column references using INDEX/MATCH instead of hardcoded positions
- Error handling formulas that gracefully manage missing data
- Validation checks that alert you when input structures change unexpectedly
- AI-assisted debugging by describing the error to get targeted solutions
When automation breaks, paste the error message into an AI assistant with context about your workflow. The detailed diagnosis often surpasses traditional Excel help resources.
Managing Performance with Large Datasets
Reports processing hundreds of thousands of rows may slow dramatically. Optimization strategies include:
- Converting formulas to values after calculation completes
- Using Power Query for heavy transformation instead of worksheet formulas
- Implementing incremental refresh instead of full data reloads
- Disabling automatic calculation during data import
AI can analyze your workbook structure and recommend specific performance improvements: "Review this workbook and identify the top 5 calculation bottlenecks."
Maintaining Version Control and Audit Trails
Automated reports modify themselves, creating challenges for tracking changes and ensuring accuracy. Professional approaches include:
- Maintaining separate "template" and "output" files
- Logging each automation run with timestamps and data source versions
- Archiving completed reports before starting new periods
- Implementing change detection that highlights modifications between runs
For teams requiring comprehensive documentation, our Excel consulting services include establishing governance frameworks for automated reporting environments.
Measuring Automation Success and ROI
Quantifying the business value of report automation justifies investment and guides continuous improvement efforts. Track meaningful metrics that demonstrate impact beyond time savings.
Time Savings Calculation
Document baseline manual effort before automation:
- Hours spent per reporting cycle
- Number of people involved
- Frequency of reports produced
- Time required for review and corrections
After automation, measure the same parameters. Most organizations achieve 70-85% time reduction for routine reports. A monthly report requiring 12 hours of manual work typically drops to 2-3 hours with comprehensive automation.
Accuracy Improvements
Manual reporting introduces errors through data entry mistakes, formula errors, and version control issues. Automated systems eliminate most human errors:
Before automation metrics:
- Error rate per report
- Time spent investigating and correcting mistakes
- Reports requiring re-issuance due to errors
After automation metrics:
- Errors detected during automated validation
- Successful report completions without manual intervention
- Stakeholder confidence scores
Business Impact Measures
Beyond operational efficiency, automation enables strategic benefits:
- Decision speed: Reports available hours or days earlier enable faster responses
- Reporting frequency: Automation enables daily or weekly reports that were previously monthly
- Coverage expansion: Freed capacity allows reporting on previously unmonitored areas
- Insight depth: Consistent formatting and delivery allow focus on analysis instead of production
Organizations implementing how to automate Excel reporting with AI typically reinvest saved time into deeper analysis, expanding coverage to new business areas, or developing additional automated workflows.
Building a Sustainable Automation Practice
Individual automated reports provide immediate value, but sustainable practices create compounding benefits across your organization. Establishing standards and processes ensures long-term success.
Documentation Standards
Every automated report requires documentation covering:
- Purpose and audience: Who uses this report and for what decisions
- Data sources: Where information originates and refresh schedules
- Transformation logic: How raw data becomes final outputs
- Known limitations: What the report cannot answer or where manual judgment applies
- Troubleshooting guide: Common issues and resolution steps
This documentation enables knowledge transfer and prevents single-person dependencies. When the report creator leaves or changes roles, others can maintain the automation.
Establishing Governance Policies
As automation expands, governance prevents chaos:
- Naming conventions for files, sheets, and data objects ensure consistency
- Security protocols protect sensitive data in automated workflows
- Change management processes prevent unauthorized modifications
- Testing requirements before deploying updates to production reports
- Backup strategies ensuring automated reports can be recovered after failures
Organizations with mature automation practices treat Excel reports like production software, applying appropriate quality controls.
Continuous Improvement Cycles
Automation isn't a one-time implementation but an evolving practice:
- Quarterly reviews assess whether automated reports still meet business needs
- User feedback identifies opportunities for additional automation or enhanced features
- Performance monitoring tracks execution times and flags degradation
- Technology updates incorporate new AI capabilities as they become available
Staying current with the best AI tool for Excel automation ensures you leverage emerging capabilities as the technology rapidly advances.
Training and Skill Development
Successful automation requires team members who understand both business requirements and technical capabilities. Investment in training accelerates adoption:
- Excel fundamentals ensure everyone understands underlying spreadsheet principles
- AI tool proficiency teaches effective prompt writing and tool utilization
- Data literacy develops critical thinking about data quality and interpretation
- Process thinking helps identify automation opportunities proactively
The Analytics Doctor offers personalized Excel training that addresses your specific automation objectives, ensuring teams develop practical skills applicable to real business scenarios.
Mastering how to automate Excel reporting with AI transforms time-consuming manual processes into efficient, reliable workflows that deliver consistent results with minimal effort. The combination of modern AI tools, structured methodologies, and sustainable practices creates reporting systems that scale with your business needs. Whether your formulas are broken, your data isn't making sense, or you just need smarter automated spreadsheets, The Analytics Doctor provides expert Excel help, training, and support to diagnose your challenges and implement clear, practical automation solutions that make your data work for you.