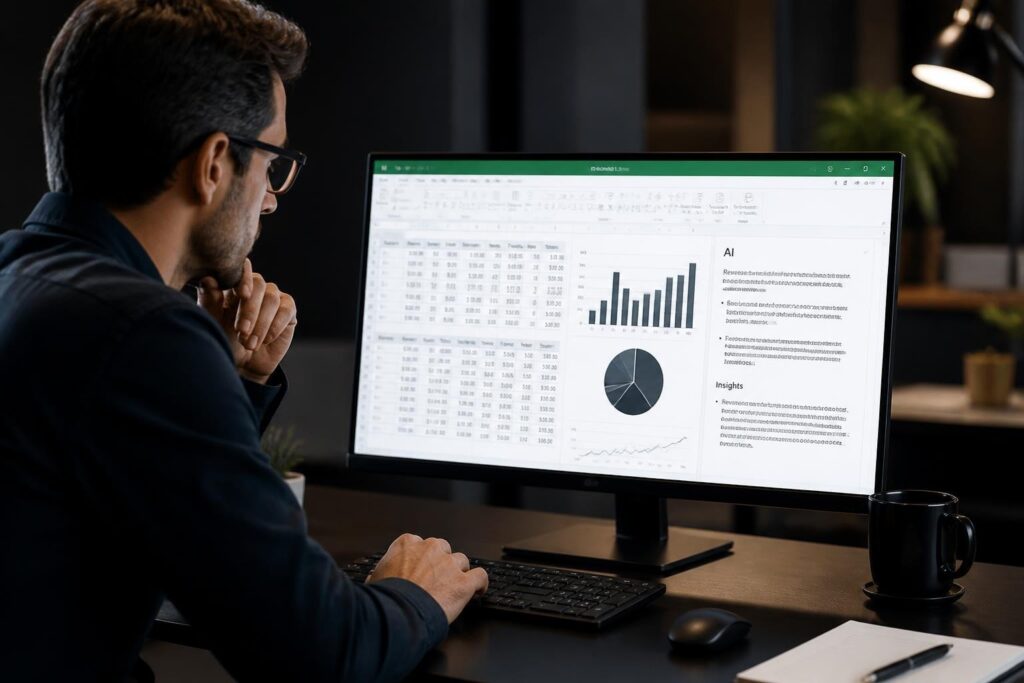
Forecasting future trends from historical data has always been a cornerstone of business planning, but the landscape has shifted dramatically in recent years. Excel forecasting with AI tools now provides professionals with unprecedented accuracy and speed when predicting sales trends, budget allocations, inventory needs, and countless other business metrics. The integration of artificial intelligence into Excel's native forecasting capabilities, combined with third-party AI tools, has transformed what used to require statistical expertise into accessible, powerful prediction workflows that anyone can implement. Understanding how to leverage these AI-enhanced forecasting methods can save hours of manual calculation while delivering more reliable results for strategic decision-making.
Understanding AI-Enhanced Forecasting in Excel
Traditional Excel forecasting relied heavily on manual formula construction and basic linear regression models. Users would build FORECAST or TREND functions manually, often struggling to account for seasonality, cyclical patterns, or complex data relationships. AI transforms this process by automatically detecting patterns, adjusting for anomalies, and applying sophisticated statistical models without requiring advanced mathematics knowledge.
Modern excel forecasting with ai tools encompasses several approaches:
- Native Excel AI features like FORECAST.ETS functions that use exponential triple smoothing
- Microsoft Copilot integration for natural language forecasting requests
- Third-party AI assistants that generate and optimize forecasting formulas
- Machine learning add-ins that process large datasets beyond traditional Excel limits
The Forecast Sheet tool introduced in Excel 2016 marked Microsoft's first major step toward AI-assisted forecasting. This feature automatically analyzes your historical data, detects seasonal patterns, and generates visual forecasts with confidence intervals. What previously required hours of statistical analysis now takes seconds with a few clicks.
Key Advantages of AI-Powered Forecasting
When you implement excel forecasting with ai tools, you gain several measurable benefits over manual methods. Accuracy improvements often range from 15-40% depending on data complexity and historical patterns. AI algorithms excel at identifying subtle trends that human analysts might miss, particularly in datasets with multiple variables or non-linear relationships.
Time savings represent another significant advantage. A sales forecast that might take two hours to build manually can be generated in under five minutes using AI assistance. This efficiency allows analysts to focus on interpreting results and making strategic recommendations rather than wrestling with formula syntax.
Implementing FORECAST.ETS Functions for Time-Series Predictions
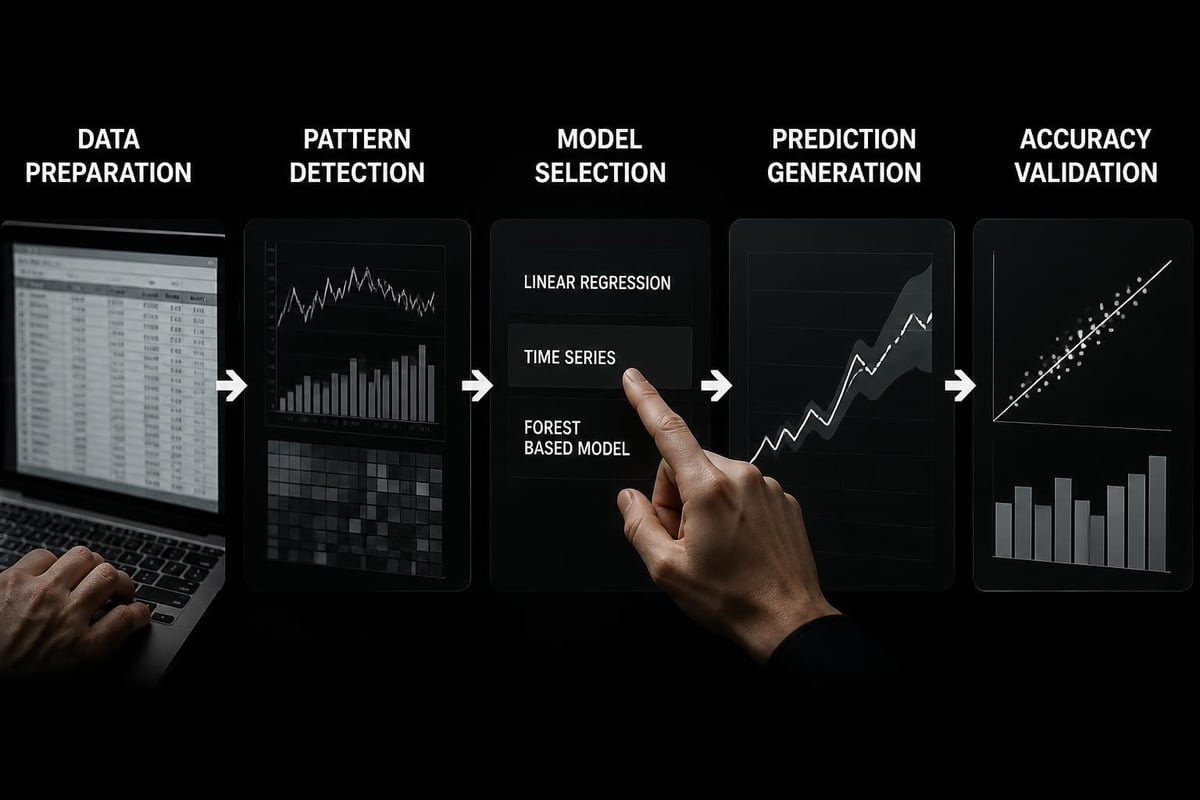
Excel's FORECAST.ETS family of functions represents the most powerful built-in option for excel forecasting with ai tools. These functions implement exponential triple smoothing (ETS) algorithms that automatically adjust for trends and seasonality in your time-series data. Unlike simple linear forecasts, ETS functions can handle complex patterns that repeat at regular intervals.
The core FORECAST.ETS function predicts a single future value based on historical data. The syntax follows this structure:
FORECAST.ETS(target_date, values, timeline, [seasonality], [data_completion], [aggregation])
Here's how each parameter contributes to accurate predictions:
| Parameter | Purpose | Best Practice |
|---|---|---|
| target_date | The future point you want to predict | Must be beyond your historical timeline |
| values | Historical data points | Clean, consistent numerical values |
| timeline | Corresponding dates/times | Regular intervals (daily, monthly, quarterly) |
| seasonality | Pattern repetition period | Let Excel auto-detect or specify manually |
| data_completion | How to handle missing values | Use 1 for interpolation in most cases |
| aggregation | Handling duplicate timestamps | Average multiple values at same time point |
The FORECAST.ETS approach works exceptionally well for business scenarios with clear seasonal patterns. Retail sales that spike during holidays, utility usage that varies by weather seasons, or subscription renewals that cluster around annual dates all benefit from this AI-powered methodology.
Companion Functions for Comprehensive Analysis
FORECAST.ETS.CONFINT calculates confidence intervals around your predictions, showing the range where actual values will likely fall. This uncertainty quantification proves invaluable when presenting forecasts to stakeholders who need to understand risk levels.
FORECAST.ETS.SEASONALITY automatically detects the seasonal pattern length in your data. If you're unsure whether your monthly sales follow a quarterly, semi-annual, or annual pattern, this function identifies it mathematically.
FORECAST.ETS.STAT returns various statistical measures about your forecast, including smoothing parameters and error metrics. These technical details help validate that your model is performing appropriately for your specific dataset.
Leveraging the Forecast Sheet Tool for Visual Predictions
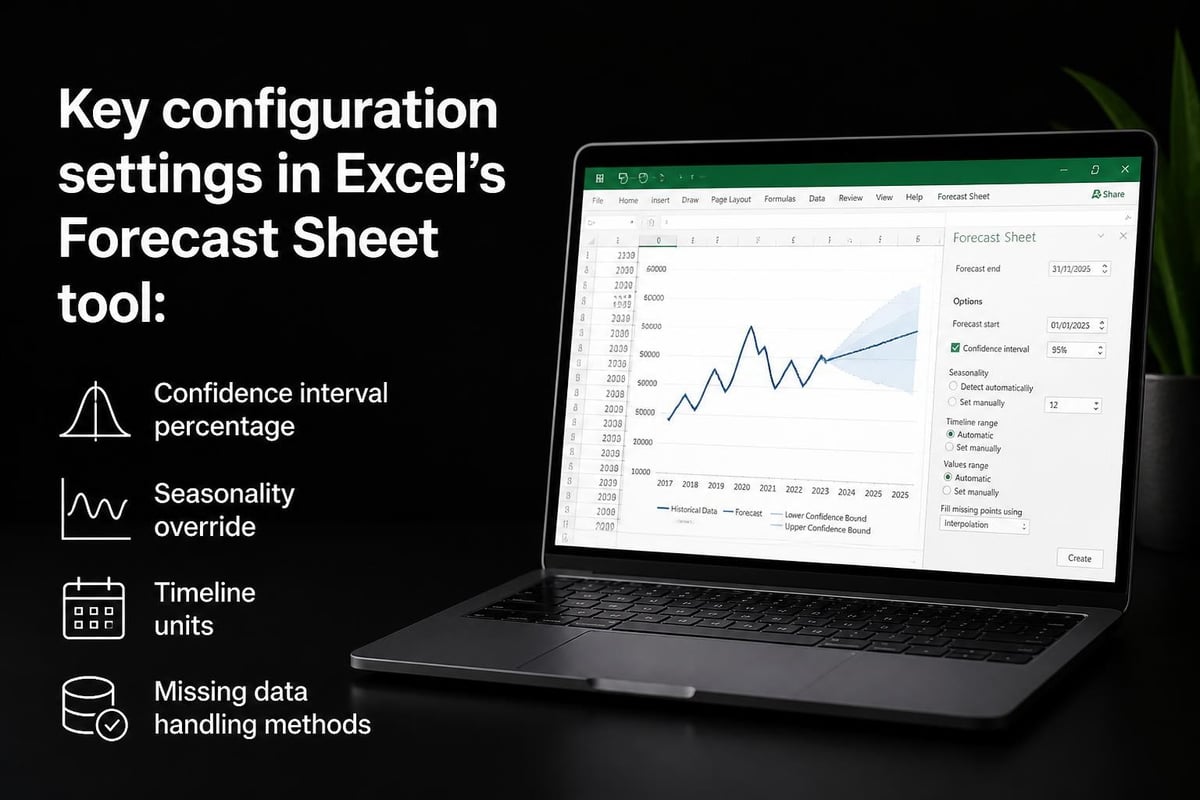
For users who prefer visual interfaces over formula construction, Excel's Forecast Sheet feature delivers excel forecasting with ai tools through an intuitive wizard-based approach. This tool analyzes your historical data, generates predictions, and creates comprehensive charts showing both historical trends and future projections.
To create a forecast sheet:
- Select your historical data range including both dates and values
- Navigate to the Data tab and click "Forecast Sheet"
- Review the preview chart showing projected values
- Adjust the forecast end date to extend predictions further
- Modify confidence interval settings (default is 95%)
- Choose between line and column chart visualization
- Click Create to generate a new worksheet with complete forecast
The resulting worksheet contains your original data plus predicted values with upper and lower confidence bounds. The step-by-step forecasting process becomes accessible to users at all skill levels, democratizing advanced analytics across your organization.
Customization options within the Forecast Sheet tool allow fine-tuning for specific business contexts. You can manually override the detected seasonality if you know your business cycles better than the automatic detection. The timeline unit selector ensures appropriate interval handling whether you're forecasting daily website traffic or annual revenue growth.
Integrating Microsoft Copilot for Natural Language Forecasting
Microsoft Copilot represents the cutting edge of excel forecasting with ai tools by allowing natural language requests instead of manual formula building. Rather than memorizing FORECAST.ETS syntax, you can simply describe what you need: "Create a six-month sales forecast based on the data in columns A and B, accounting for seasonal patterns."
Copilot interprets your request, analyzes your data structure, selects appropriate forecasting methods, and generates both formulas and visualizations. This conversational approach removes the technical barriers that previously prevented non-analysts from creating sophisticated predictions. Our guide on how to use Copilot in Excel provides detailed instructions for maximizing this powerful integration.
The AI assistant can also explain its forecasting methodology in plain language. When you ask "Why does the forecast show an increase in Q3?", Copilot references the historical patterns it detected and explains the statistical reasoning behind the prediction. This transparency helps build confidence in AI-generated forecasts among stakeholders who might be skeptical of "black box" predictions.
Copilot Formula Generation and Refinement
Beyond simple forecast creation, Copilot excels at iterative refinement. If your initial forecast doesn't account for a known business change, you can instruct: "Adjust the forecast to include a 15% increase starting in March due to new product launch." The AI modifies formulas accordingly while maintaining statistical rigor.
Error diagnosis becomes significantly faster with Copilot assistance. When a FORECAST.ETS function returns an error, describing the problem in natural language often yields immediate solutions. Check out our Copilot Excel formulas examples for specific forecasting scenarios and how to phrase your requests for optimal results.
Third-Party AI Tools for Advanced Forecasting Scenarios
While Excel's native capabilities handle most forecasting needs, certain scenarios benefit from specialized third-party AI tools. These external solutions integrate with Excel to provide enhanced functionality for complex prediction challenges.
Machine learning platforms like Azure Machine Learning can connect to Excel workbooks and apply advanced algorithms including random forests, gradient boosting, and neural networks. These methods outperform traditional time-series forecasting when dealing with multiple input variables or non-linear relationships.
AI-powered analytics add-ins bring sophisticated modeling capabilities directly into the Excel interface. Tools like Analytic Solver and XLMiner offer:
- Automated variable selection to identify the most predictive factors
- Ensemble forecasting that combines multiple models for improved accuracy
- Monte Carlo simulation for probability-based scenario planning
- Automatic outlier detection and adjustment
The integration process for excel forecasting with ai tools typically involves connecting your workbook to cloud-based AI services. Data flows from your spreadsheet to the AI engine, which processes predictions and returns results to designated cells or worksheets.
Data Preparation for AI-Enhanced Accuracy
Regardless of which AI tools you employ, data quality determines forecast accuracy more than algorithm sophistication. Clean your dataset by:
- Removing duplicate timestamps that confuse time-series algorithms
- Standardizing date formats to ensure proper chronological ordering
- Addressing missing values through interpolation or deletion
- Smoothing extreme outliers that don't represent normal business patterns
- Verifying numerical formats to prevent text-as-number issues
Our comprehensive resource on automating Excel tasks with AI covers data cleaning workflows that prepare your spreadsheets for optimal forecasting performance.
Comparing Forecasting Methods for Different Business Contexts
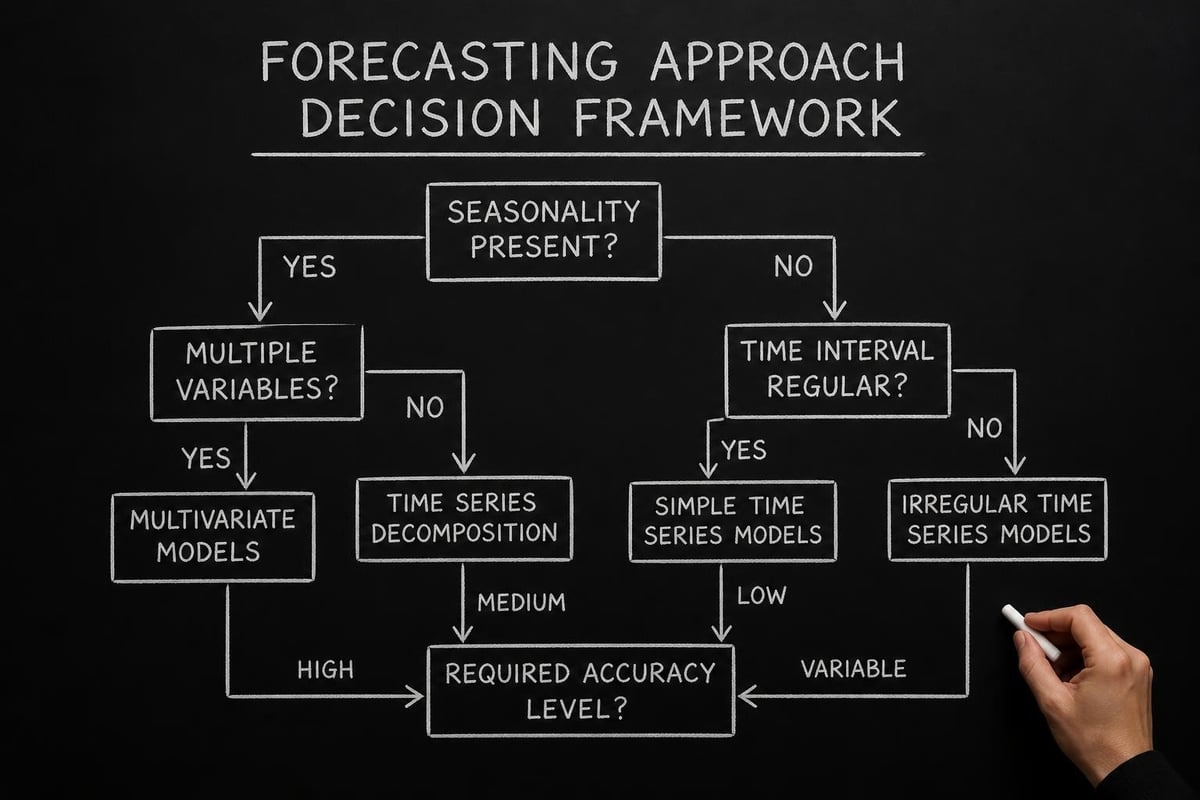
Selecting the appropriate approach for excel forecasting with ai tools depends on your specific business context, data characteristics, and accuracy requirements. Different methods excel in different scenarios, and understanding these distinctions prevents misapplication of techniques.
| Method | Best For | Limitations | Typical Accuracy |
|---|---|---|---|
| FORECAST.LINEAR | Simple trends, no seasonality | Cannot handle patterns | ±10-15% |
| FORECAST.ETS | Seasonal time-series | Requires regular intervals | ±5-10% |
| Forecast Sheet | Visual presentations | Limited customization | ±5-10% |
| Copilot | Quick ad-hoc forecasts | Requires Microsoft 365 subscription | ±5-12% |
| ML Add-ins | Multi-variable predictions | Higher complexity | ±3-8% |
Sales forecasting typically benefits most from FORECAST.ETS functions due to the seasonal nature of purchasing patterns. Retail businesses see demand spikes during holidays, while B2B companies often experience quarterly cyclical patterns tied to budget cycles.
Budget and expense projections often work well with simpler linear forecasting, especially for relatively stable cost categories like rent, utilities, or salaries. However, variable expenses tied to business activity require more sophisticated approaches that incorporate multiple input factors.
Revenue forecasting for subscription businesses presents unique challenges addressed well by AI-enhanced revenue forecasting methods. The combination of predictable recurring revenue and variable churn rates requires models that handle both steady trends and probabilistic events.
Validating and Improving Forecast Accuracy
Creating predictions represents only half of effective excel forecasting with ai tools. Validation and continuous improvement ensure your forecasts remain reliable as business conditions evolve. Backtesting provides the most rigorous accuracy assessment by applying your forecasting model to historical data where you already know the actual outcomes.
To backtest a forecast model:
- Reserve the most recent 20-30% of historical data as a test set
- Build your forecast using only the older data
- Generate predictions for the test period
- Compare predicted values against actual results
- Calculate error metrics like MAPE (Mean Absolute Percentage Error)
Acceptable error thresholds vary by industry and business context. Retail sales forecasts within ±10% are generally considered good, while financial forecasts may require ±5% or better. Understanding your specific accuracy needs prevents over-engineering simple forecasts or under-analyzing critical predictions.
The FORECAST.ETS.STAT function provides several error metrics automatically. The normalized mean absolute error (NMAE) proves particularly useful for comparing forecasts across different data ranges or time periods. Lower NMAE values indicate better model fit to historical patterns.
Continuous Model Refinement Strategies
As new data becomes available, update your forecasting models regularly to maintain accuracy. The frequency depends on your data velocity and business needs:
- Daily forecasts (website traffic, inventory) should refresh daily or weekly
- Monthly forecasts (sales, expenses) benefit from monthly updates
- Quarterly/annual forecasts (revenue, headcount) typically update quarterly
Advanced practitioners implement rolling forecasts that automatically incorporate new data and drop old periods. This approach maintains consistent forecast horizons while ensuring models stay current with recent trends. Tools for automating Excel reports with Copilot can schedule these updates without manual intervention.
Practical Applications Across Business Functions
Excel forecasting with ai tools serves diverse functional areas within organizations, each with specific requirements and best practices. Understanding these applications helps you tailor forecasting approaches to departmental needs.
Supply chain and inventory management relies heavily on demand forecasting to optimize stock levels. The cost of stockouts versus excess inventory requires accurate predictions with quantified uncertainty ranges. FORECAST.ETS confidence intervals help inventory managers set reorder points that balance these competing risks.
Financial planning and analysis (FP&A) teams use forecasting for budget development, variance analysis, and strategic planning. Multi-scenario forecasting becomes critical here, where analysts create base, optimistic, and pessimistic predictions to support decision-making under uncertainty.
Marketing and sales operations apply forecasting to campaign planning, quota setting, and resource allocation. Seasonal promotional patterns and market trends make these forecasts particularly complex. Our guide on marketing analytics with Excel explores these specialized applications in depth.
Human resources departments forecast hiring needs, turnover rates, and compensation budgets. The Excel Forecast function’s regression capabilities work well for headcount projections based on growth rates and historical hiring patterns.
Building Executive Dashboards with Forecasting Components
Forecasts gain maximum impact when integrated into comprehensive dashboards that combine historical performance with future projections. Excel's native charting capabilities allow you to create compelling visualizations that show:
- Actual performance versus previous forecasts to build credibility
- Current trajectory with confidence bands for risk assessment
- Multiple scenarios with toggle controls for interactive exploration
- Key performance indicators derived from forecast outputs
Learn how to construct these integrated analytical tools through our tutorial on Excel dashboard creation with AI. The combination of visual clarity and predictive power makes dashboards essential executive communication tools.
Common Challenges and Troubleshooting Solutions
Even with AI assistance, excel forecasting with ai tools presents challenges that require systematic troubleshooting. Recognizing common issues and their solutions prevents frustration and improves results.
Irregular time intervals cause the most frequent problems with FORECAST.ETS functions. The algorithm expects consistent spacing between data points (daily, weekly, monthly). When your data skips weekends, has gaps for holidays, or contains irregular entries, errors result. Solutions include:
- Fill missing periods with interpolated values
- Use the data_completion parameter to handle gaps automatically
- Aggregate irregular data into regular intervals before forecasting
Insufficient historical data limits AI effectiveness. Most forecasting algorithms require at least two complete seasonal cycles for reliable pattern detection. Monthly sales forecasts need 24-36 months of history, while quarterly forecasts require 8-12 quarters minimum.
Structural breaks occur when fundamental business changes invalidate historical patterns. A new competitor, product launch, or market shift means past data no longer predicts future performance. In these cases, consider:
- Weighting recent data more heavily in your forecasts
- Manually adjusting AI-generated predictions based on known changes
- Building separate models for pre-change and post-change periods
The methods for forecasting based on historical data provide additional troubleshooting guidance for specific scenario types.
Combining AI Tools for Optimal Results
The most sophisticated practitioners don't rely on a single approach but instead combine multiple excel forecasting with ai tools to leverage their complementary strengths. This ensemble methodology improves accuracy and provides validation across different analytical perspectives.
A practical combination workflow might involve:
- Use Copilot to generate initial forecasts and identify data issues
- Apply FORECAST.ETS for baseline time-series predictions
- Create Forecast Sheets for visual stakeholder presentations
- Validate with external AI tools for high-stakes decisions
- Compare results across methods to identify outliers or consensus
When multiple forecasting approaches agree on similar predictions, confidence increases substantially. Conversely, significant divergence signals the need for deeper investigation into data quality, model assumptions, or business context factors.
Weighted ensemble forecasting takes this concept further by combining predictions from different models based on their historical accuracy. If FORECAST.ETS has shown 8% MAPE while a machine learning model achieves 6% MAPE on your specific data, weight the ML predictions more heavily in your final forecast. Excel's simple weighted average formulas make this calculation straightforward.
Our comparison guides like Gemini vs Copilot for Excel and Claude vs Copilot for Excel help you evaluate which AI assistants work best for different forecasting scenarios in your workflow.
Future Trends in AI-Powered Excel Forecasting
The evolution of excel forecasting with ai tools continues accelerating as artificial intelligence capabilities advance and integrate more deeply with spreadsheet platforms. Understanding emerging trends helps you prepare for coming changes and identify opportunities for competitive advantage.
Real-time data integration will eliminate the lag between data collection and forecast updates. Rather than manually refreshing Excel workbooks with new data, AI tools will continuously monitor connected data sources and automatically regenerate forecasts as new information becomes available.
Explainable AI addresses the "black box" criticism of machine learning forecasts by providing detailed reasoning for predictions. Future Excel AI tools will explain not just what they predict but why, citing specific historical patterns, detected anomalies, and statistical confidence factors that drive each forecast value.
Natural language forecast querying will expand beyond Copilot's current capabilities to allow conversational exploration of prediction scenarios. Business users will ask complex questions like "How would Q4 revenue forecast change if we increase marketing spend by 20%?" and receive immediate, data-driven responses.
Automated model selection will test multiple forecasting algorithms against your specific dataset and automatically choose the optimal approach. Rather than manually deciding between linear, exponential, or machine learning methods, AI will evaluate options and select based on empirical accuracy metrics.
These advances promise to make sophisticated forecasting accessible to even more Excel users while improving prediction quality across all experience levels. Staying current with best AI tools for Excel automation ensures you adopt beneficial new capabilities as they emerge.
Excel forecasting with AI tools has transformed prediction workflows from complex statistical exercises into accessible, accurate processes that drive better business decisions. Whether you're using native FORECAST.ETS functions, visual Forecast Sheets, or advanced AI assistants, the key lies in selecting appropriate methods for your specific context and continuously validating results against actual outcomes. If you're struggling with forecasting challenges or want to optimize your predictive analytics workflows, The Analytics Doctor provides expert guidance tailored to your specific spreadsheet needs. From building robust forecasting models to automating prediction updates, we deliver practical solutions that transform your data into reliable future insights.