Data visualization has always been one of Excel's most powerful capabilities, but artificial intelligence is fundamentally changing how we transform numbers into insights. Excel data visualization with AI combines the familiar power of spreadsheets with machine learning algorithms that can identify patterns, suggest optimal chart types, and create compelling visualizations in seconds. This technology isn't replacing the analyst's expertise but rather amplifying it, making sophisticated data storytelling accessible to users at every skill level.
The Evolution of Excel Data Visualization
Traditional Excel charting required users to manually select data ranges, choose appropriate chart types, and adjust formatting elements one by one. While powerful, this process demanded significant knowledge of visualization best practices and consumed valuable time. The introduction of AI-powered features in Microsoft Excel has transformed this workflow entirely.
Modern excel data visualization with ai leverages natural language processing and machine learning to understand data context. Instead of navigating through ribbon menus and dialog boxes, users can now describe their visualization needs in plain English. The AI interprets the request, analyzes the data structure, and generates appropriate visual representations automatically.
How AI Understands Your Data
Machine learning algorithms examine your spreadsheet data across multiple dimensions simultaneously. They evaluate column types, identify numerical versus categorical data, detect time series patterns, and recognize relationships between variables. This comprehensive analysis happens in milliseconds, providing a foundation for intelligent visualization recommendations.
Key capabilities include:
- Automatic detection of data types and formats
- Pattern recognition across rows and columns
- Identification of correlations and trends
- Recognition of outliers and anomalies
- Understanding of temporal sequences
The sophistication of these systems continues to advance, with recent research in AI-driven visualization tools demonstrating how algorithms can transform raw data into meaningful visual representations with minimal user intervention.

AI-Powered Visualization Tools for Excel
The ecosystem of excel data visualization with ai tools has expanded rapidly, offering solutions for various use cases and skill levels. These platforms integrate with Excel through different methods, from native features to third-party add-ins and standalone applications that import spreadsheet data.
Microsoft Copilot Integration
Microsoft has embedded AI directly into Excel through Copilot functionality. According to recent developments, the =COPILOT function now allows users to access AI assistance within individual cells, extending beyond visualization to comprehensive data analysis support.
Copilot capabilities for visualization:
- Natural language chart creation
- Automatic formatting suggestions
- Dynamic dashboard generation
- Interactive data exploration
- Presentation-ready visual output
Specialized AI Visualization Platforms
Beyond Microsoft's native tools, specialized platforms have emerged to address specific visualization challenges. RowSpeak enables users to create charts and dashboards through conversational queries, translating plain English questions into sophisticated visual analytics. Similarly, ChartMagic provides AI-powered chart suggestions after analyzing uploaded Excel files, streamlining the decision-making process for chart selection.
For organizations requiring enterprise-grade solutions, Energent.ai’s Excel data visualization platform offers instant chart creation without complex formulas or coding requirements, making advanced analytics accessible to non-technical users.
| Tool | Primary Strength | Best For | Integration Method |
|---|---|---|---|
| Microsoft Copilot | Native Excel integration | Office 365 users | Built-in function |
| RowSpeak | Natural language queries | Quick ad-hoc analysis | Web platform import |
| ChartMagic | AI chart recommendations | Chart type selection | File upload |
| Energent.ai | No-code creation | Business users | Cloud-based platform |
Practical Applications and Workflows
Implementing excel data visualization with ai effectively requires understanding where these tools deliver the greatest value. The technology excels in scenarios where speed, pattern discovery, and accessibility are critical factors.
Financial Reporting and Dashboards
Financial analysts spend considerable time creating monthly reports and executive dashboards. AI visualization tools can automate this process by learning from historical report structures and automatically updating visualizations as new data arrives. The system recognizes key metrics, maintains consistent formatting, and highlights significant variances without manual intervention.
Working with Microsoft Excel consulting services can help organizations establish these automated workflows, ensuring that AI tools align with existing reporting standards and business requirements.
Sales and Performance Analytics
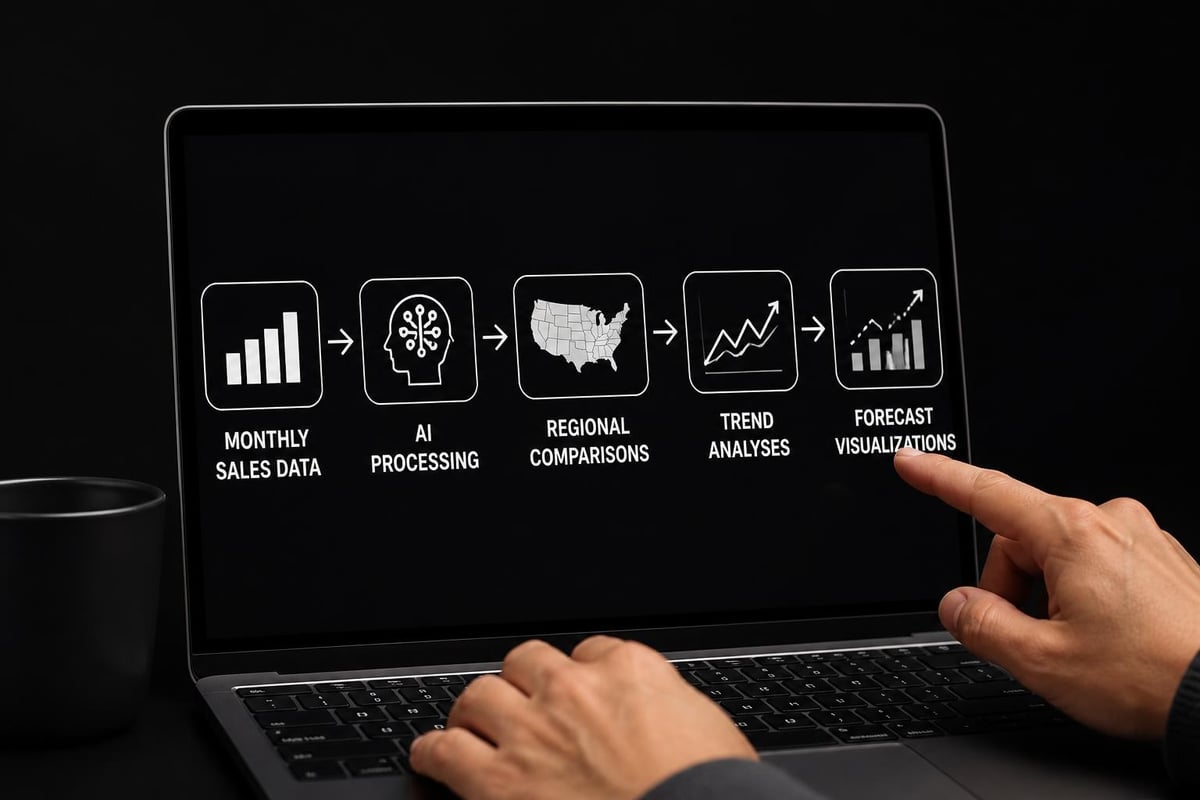
Sales teams benefit from AI-powered visualizations that automatically segment data by region, product, or time period. The technology identifies top performers, flags declining trends, and surfaces opportunities that might be hidden in raw numbers. These insights appear as interactive charts that stakeholders can explore without understanding complex formulas.
Common sales visualizations enhanced by AI:
- Territory performance comparisons
- Product mix analysis over time
- Customer acquisition funnel metrics
- Revenue forecasting with confidence intervals
- Commission calculations and distributions
Scientific and Research Data
Researchers working with experimental data appreciate how excel data visualization with ai can identify correlations across multiple variables. For instance, when analyzing correlation coefficients, AI tools can automatically generate scatter plots, heat maps, and regression visualizations that reveal relationships between measured parameters.
The artificial intelligence approaches to data visualization research demonstrates how these techniques enhance scientific discovery by making complex multivariate relationships visible and interpretable.
Best Practices for AI-Enhanced Visualization
While AI tools dramatically simplify visualization creation, following established best practices ensures that generated charts communicate effectively and maintain professional standards. The technology serves as an accelerator, not a replacement for sound visualization principles.
Data Preparation Fundamentals
AI algorithms perform best when working with clean, well-structured data. Before engaging visualization tools, ensure your spreadsheet follows these guidelines:
- Use clear column headers that describe the data content
- Maintain consistent data types within each column
- Remove or flag missing values to prevent misinterpretation
- Structure dates properly using Excel date formats
- Eliminate merged cells that confuse data boundaries
These preparation steps improve AI accuracy and reduce the need for manual corrections. Data validation techniques help maintain data quality before visualization begins.
Validating AI Recommendations
AI-generated visualizations should always undergo human review. The technology may suggest technically accurate charts that don't align with your communication objectives or audience needs. Consider these validation questions:
- Does the chart type match the story you're telling?
- Are axis scales appropriate and not misleading?
- Is the color scheme accessible to colorblind viewers?
- Do labels and legends provide sufficient context?
- Would your audience understand this without explanation?
Iterative Refinement
Excel data visualization with ai works best as an iterative partnership. Start with AI-generated suggestions, evaluate the results, provide feedback through natural language commands, and refine the output until it meets your standards. Most advanced platforms learn from these interactions, improving future recommendations based on your preferences.
Advanced Techniques and Integration
Power users can extend excel data visualization with ai capabilities by combining multiple technologies and leveraging programmatic interfaces. These advanced approaches unlock sophisticated automation and customization options.
Combining Macros with AI
For users familiar with enabling and working with macros, integrating AI visualization tools through VBA code creates powerful automation workflows. Macros can prepare data, trigger AI analysis, capture results, and distribute visualizations to stakeholders on scheduled intervals.
This hybrid approach maintains the flexibility of traditional Excel automation while incorporating modern AI capabilities. Organizations can build custom solutions that address unique business requirements not covered by standard AI tools.
API-Based Workflows
Many AI visualization platforms offer application programming interfaces that allow Excel to communicate with cloud-based analysis engines. This architecture keeps sensitive data on-premises while leveraging powerful cloud computing for visualization generation. Recent developments in AI-powered platforms demonstrate how automated dataset analysis can streamline interactive visualization creation.
Implementation considerations:
| Aspect | On-Premises Solution | Cloud API Integration |
|---|---|---|
| Data Security | Full control | Requires encryption |
| Processing Power | Limited by hardware | Virtually unlimited |
| Scalability | Manual expansion | Automatic scaling |
| Cost Structure | Upfront investment | Usage-based pricing |
| Internet Dependency | Not required | Essential for operation |
Custom AI Model Training
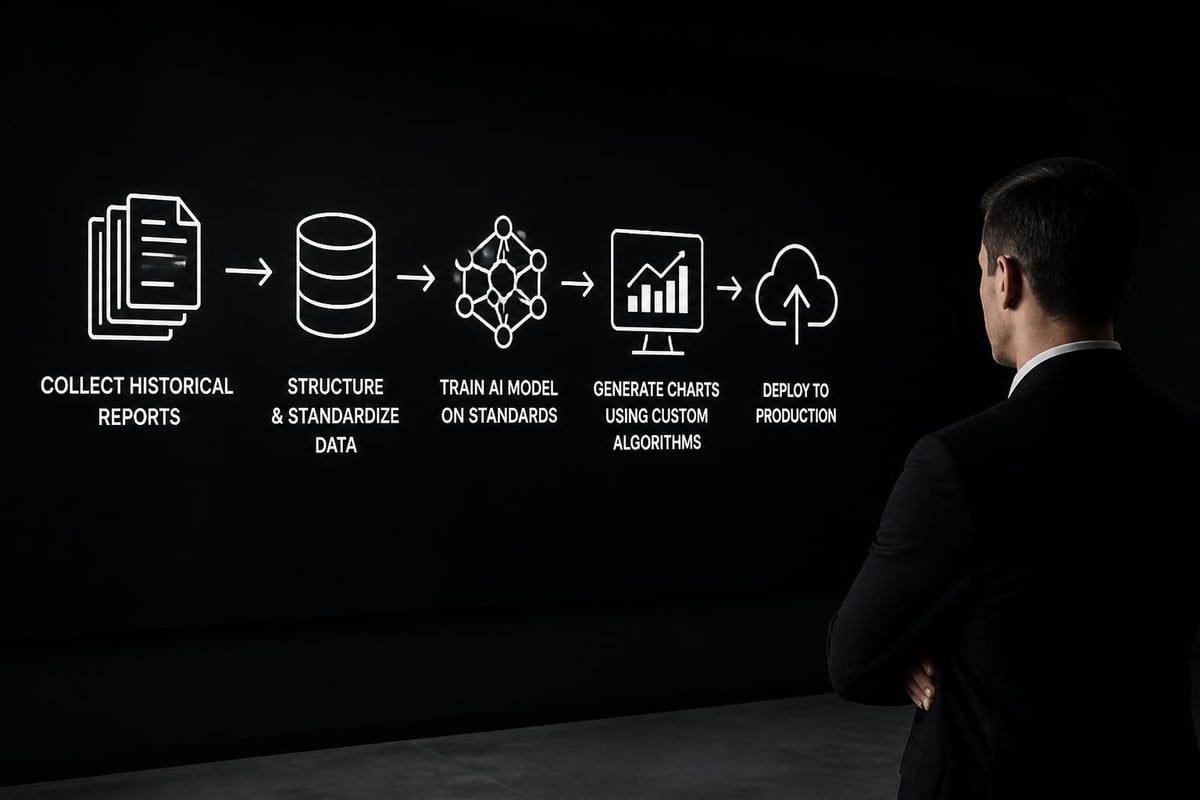
Organizations with specialized visualization needs can train custom AI models on their historical reports and dashboards. These models learn company-specific chart preferences, branding requirements, and analytical approaches. When deployed, they generate visualizations that match established corporate standards automatically.
Overcoming Common Challenges
Despite its advantages, excel data visualization with ai presents certain challenges that users should anticipate and address proactively. Understanding these limitations helps set realistic expectations and develop mitigation strategies.
Data Complexity and Context
AI algorithms excel at pattern recognition but may struggle with nuanced business context that humans understand implicitly. A sudden spike in sales data might indicate success or a data entry error depending on circumstances the AI cannot evaluate. Always apply domain knowledge when interpreting AI-generated visualizations.
Version Compatibility Issues
Newer AI features often require recent Excel versions or Office 365 subscriptions. Organizations using older Microsoft Office Excel versions may find limited AI functionality available. Third-party tools can bridge this gap, though they introduce additional complexity.
Solutions for legacy Excel versions:
- Export data to cloud-based AI platforms
- Use standalone visualization applications
- Upgrade critical users to Office 365
- Implement hybrid workflows with newer software
Security and Privacy Concerns
Sending spreadsheet data to cloud-based AI services raises legitimate security questions, especially for confidential financial or customer information. Organizations must evaluate vendor security practices, data handling policies, and compliance certifications before implementing these tools. Password protecting Excel files provides one layer of security, but comprehensive data governance requires broader policies.
Measuring Success and ROI
Implementing excel data visualization with ai represents an investment of time and resources. Quantifying the return on this investment helps justify continued use and expansion of these capabilities.
Time Savings Metrics
Track the hours previously spent creating visualizations manually versus the time required with AI assistance. Most organizations report 60-80% time reductions for routine chart creation, with even greater savings for complex dashboards requiring multiple interconnected visualizations.
Quality Improvements
Beyond speed, assess whether AI-generated visualizations improve communication effectiveness. Survey stakeholders to determine if they find AI-enhanced reports clearer, more actionable, or more engaging than previous versions. Improved decision-making quality often justifies AI adoption even without dramatic time savings.
Adoption and Usage Rates
Monitor how many team members actively use AI visualization tools versus those who continue with traditional methods. Low adoption rates may indicate training needs, tool usability issues, or insufficient awareness of available capabilities. Successful implementations typically achieve 70%+ adoption within three months.
Future Developments and Trends
The field of excel data visualization with ai continues evolving rapidly, with several emerging trends likely to impact how professionals work with spreadsheet data in the coming years.
Conversational Interfaces
Tools like the Grok add-in for Excel demonstrate the trend toward conversational AI that understands complex, multi-step requests. Future developments will likely enable even more sophisticated dialogue, where users iteratively refine visualizations through natural conversation rather than menu selections.
Predictive Visualization
Current AI tools primarily visualize existing data, but emerging capabilities will predict future trends and automatically create visualizations showing forecasted scenarios. These predictive visualizations will include confidence intervals and alternative scenarios, helping decision-makers understand potential outcomes before they occur.
Anticipated capabilities:
- Automatic anomaly detection with alert visualizations
- Self-updating dashboards that adapt to changing data patterns
- Augmented reality visualization for immersive data exploration
- Voice-controlled chart creation and manipulation
- Collaborative AI that learns team preferences over time
Integration with Business Intelligence
The boundary between Excel and enterprise business intelligence platforms continues blurring. Excel data visualization with ai will increasingly connect to corporate data warehouses, combining spreadsheet flexibility with enterprise-scale data infrastructure. This integration allows casual users to create sophisticated visualizations without learning complex BI tools.
Training and Skill Development
Maximizing value from AI visualization tools requires developing new competencies that blend traditional Excel skills with AI literacy. Professional development in this area ensures teams can leverage these capabilities effectively.
Essential Skills for AI-Enhanced Visualization
Users need foundational understanding in three areas: Excel data management, visualization principles, and AI tool operation. While AI reduces technical barriers, professionals who understand underlying concepts produce superior results. Expert Excel training provides the foundation needed to work effectively with AI-enhanced tools.
Key learning objectives include:
- Understanding when to accept versus override AI suggestions
- Recognizing bias and limitations in algorithm recommendations
- Structuring data to optimize AI performance
- Interpreting AI confidence levels and uncertainty indicators
- Combining multiple AI tools for complex projects
Continuous Learning Approaches
The rapid evolution of excel data visualization with ai means that skills require regular updating. Establish practices for staying current with new features, updated algorithms, and emerging best practices. Subscribe to vendor release notes, participate in user communities, and experiment with new capabilities in low-risk environments before production deployment.
Excel data visualization with AI represents a fundamental shift in how professionals transform data into insights, combining spreadsheet familiarity with machine learning sophistication. Whether you're struggling with complex visualizations, looking to automate routine reporting, or wanting to unlock hidden patterns in your data, the right approach and tools can dramatically improve your analytical capabilities. When your spreadsheets aren't delivering the insights you need, The Analytics Doctor offers personalized training and expert support to help you master both traditional Excel techniques and cutting-edge AI visualization tools, ensuring your data works smarter for you.