Excel’s moving average tools have the power to turn raw numbers into clear, actionable trends. Yet, many users find it challenging to unlock their full potential.
Whether you’re tracking sales, studying weather patterns, or monitoring stock prices, understanding moving averages can make your forecasts and decisions far more reliable.
This 2026 guide is designed for everyone, from beginners to advanced users. It breaks down each step, formula, and tool you need to master moving averages in Excel.
By the end, you’ll know how to apply moving averages, use advanced features, and solve common issues with confidence.
Learn how to calculate moving average excel using built-in tools, smart formulas, and proven best practices.
We’ll cover what moving averages are, why they matter, step-by-step calculation methods, hands-on examples, advanced techniques, and expert Excel tips.
Understanding Moving Averages in Excel
A moving average is a foundational concept in data analysis, and understanding how to calculate moving average excel is crucial for anyone looking to uncover trends hidden within raw numbers. In simple terms, a moving average calculates the mean of a specific number of recent data points, updating as you move through your dataset. This technique smooths out random fluctuations, giving a clearer picture of the underlying pattern.
Types of Moving Averages
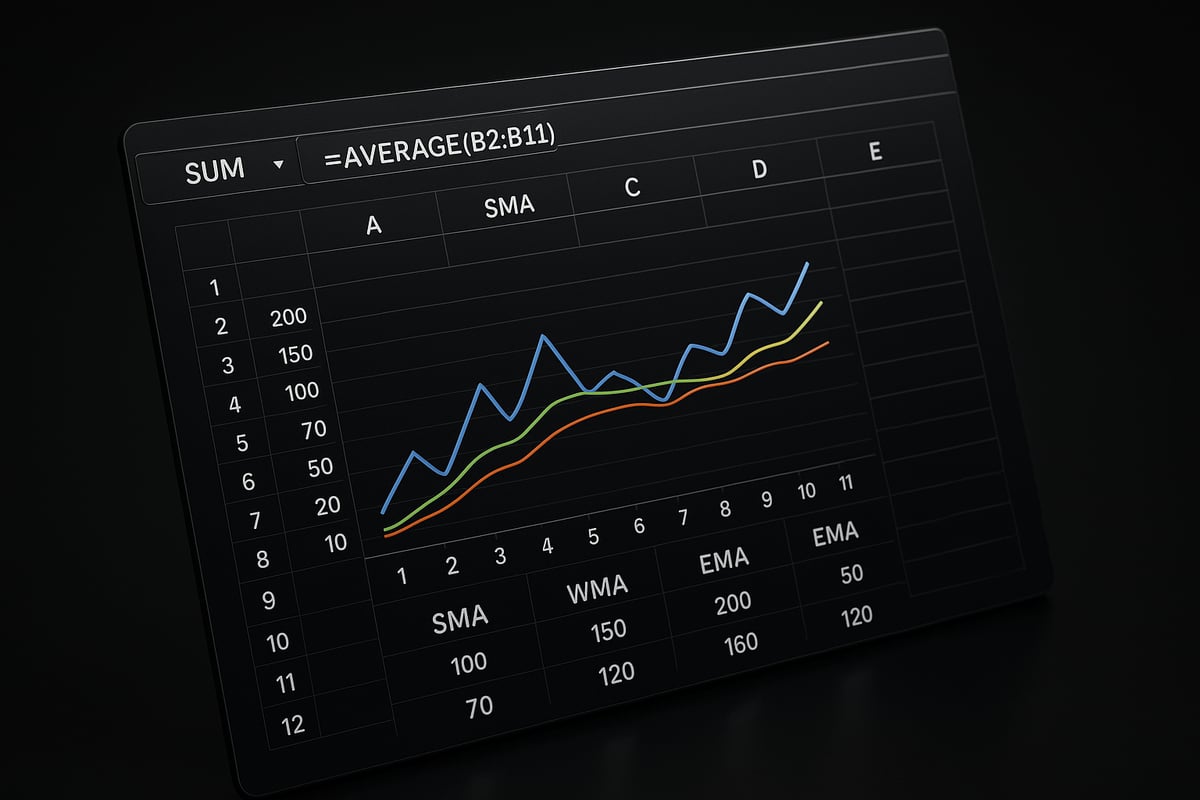
There are three main types of moving averages used in Excel:
| Type | Description | Best Use Case |
|---|---|---|
| Simple Moving Average (SMA) | Averages the last N data points equally | Stable trends, sales, inventory |
| Weighted Moving Average (WMA) | Assigns more weight to recent data points | Emphasizing recent changes |
| Exponential Moving Average (EMA) | Applies exponentially decreasing weights to older data | Fast-changing datasets, stock prices |
Each type plays a unique role in how to calculate moving average excel for different scenarios. The SMA is perfect for steady environments, while the WMA and EMA provide more responsiveness to recent shifts.
Common Use Cases
Moving averages are used across industries. Some common applications include:
- Financial analysis and stock price forecasting
- Inventory management and demand planning
- Monitoring weather data trends
- Quality control in manufacturing
- Website analytics and traffic analysis
Knowing how to calculate moving average excel allows you to reduce noise in large datasets, making it easier to spot actionable insights.
Smoothing Fluctuations and Revealing Trends
The main advantage of a moving average is its ability to filter out random spikes or dips. By averaging a set number of past values, you reveal a steadier trend line. For example, if daily sales fluctuate due to promotions or seasonality, a 7-day moving average will show the overall performance trajectory.
Mathematically, the formula for a simple moving average in Excel is straightforward. For a 3-day moving average, you would use:
=AVERAGE(B2:B4)
Drag this formula down your column to see the rolling average update with each new data point.
Moving Averages vs. Other Trend Tools
Unlike linear trendlines or exponential smoothing, moving averages do not predict future values but instead clarify the present trend by minimizing random variation. This sets them apart as a preferred method for ongoing monitoring rather than forecasting.
Benefits of Using Moving Averages in Excel
Excel makes it easy to apply moving averages, whether with built-in tools or custom formulas. You can quickly visualize trends, compare different moving average intervals, and integrate these insights into your broader data analysis in Excel workflow. This flexibility supports better business decisions and more accurate research outcomes.
Example: Visualizing a Moving Average
Suppose you track monthly sales for a year. Plotting both the raw sales and a 3-month moving average on a line chart instantly highlights periods of growth or decline. The moving average line smooths out one-off surges or drops, allowing for a more strategic overview.
Mastering how to calculate moving average excel empowers you to turn chaotic data into reliable, actionable trends for any analysis.
Preparing Your Data for Moving Average Calculations
Before you jump into how to calculate moving average excel, it is crucial to ensure your data is clean and well-organized. Proper preparation makes your analysis smoother, improves accuracy, and helps prevent common calculation errors. Whether you are working with sales numbers, temperature logs, or financial figures, reliable data is the foundation of meaningful results.
Start by reviewing your dataset for consistency. Make sure each column has a clear heading and all values use the same data type. Remove any unnecessary blanks or duplicate entries. This preparation step not only saves time but also reduces the risk of mistakes when you move on to calculating your moving averages.
Common Data Issues and How to Fix Them
Even experienced users face data issues that can disrupt how to calculate moving average excel. Identifying and correcting these problems early is essential for precise results.
Typical issues include:
- Data entry errors, such as typos or misplaced decimal points
- Outliers that can skew your moving average
- Inconsistent formats (dates, numbers, text)
You can use Excel functions like ISNUMBER, IFERROR, and CLEAN to sanitize your dataset. For example, apply =IFERROR(A2, 0) to replace error values with zero, ensuring that calculations continue smoothly. If you spot outliers, consider using filters or conditional formatting to flag and review them before analysis.
To minimize errors, adopt a preflight workflow. Following best practices for reducing spreadsheet errors can make a significant difference, especially when preparing data for moving averages. A consistent approach will help you avoid disruptions during analysis.
Setting Up Your Excel Worksheet
A well-structured worksheet is vital for how to calculate moving average excel effectively. Begin by labeling each data column clearly, such as "Date" and "Value." Use the first row for these labels, as Excel’s Data Analysis Toolpak relies on them to identify your data range.
Arrange your data in consecutive rows, without blanks, to prevent gaps in calculations. When entering formulas, decide whether to use absolute ($A$2:$A$10) or relative (A2:A10) cell references. Absolute references are helpful when you want your formula to always refer to a specific range, while relative references allow for easy copying down a column.
For larger datasets, consider using named ranges. Assigning a name like SalesData to your range improves clarity and reduces formula errors. Excel’s sorting and filtering tools can help you quickly organize or isolate data before calculating a moving average.
Taking time to set up your worksheet not only streamlines your workflow but ensures that your results are transparent and easy to audit. By following these steps, you will be ready to move on to the next stage of moving average analysis with confidence.
Step-by-Step: How to Calculate Moving Average in Excel (2026)
Unlocking the power of moving averages in Excel can dramatically improve your data analysis. If you have ever wondered how to calculate moving average excel in a way that is both accurate and efficient, this guide will walk you through every step. Whether you are working with sales, inventory, or temperature data, mastering these calculations will help you reveal trends and make smarter decisions.
Understanding Your Options
Before diving into the process, it is important to know that Excel 2026 offers several ways to calculate moving averages:
- Built-in Data Analysis Toolpak
- Manual formulas using AVERAGE or more advanced functions
- Charting tools with trendlines
The most user-friendly method, especially for beginners, is the built-in Moving Average feature. This approach minimizes manual errors and streamlines your workflow.
Activating the Data Analysis Toolpak
If you have not used Excel's Data Analysis Toolpak before, you must enable it:
- Go to the
Filetab, selectOptions. - Click on
Add-ins. - In the Manage box, choose
Excel Add-insand clickGo. - Check
Analysis Toolpakand clickOK.
Once activated, you will find the Toolpak under the Data tab as Data Analysis.
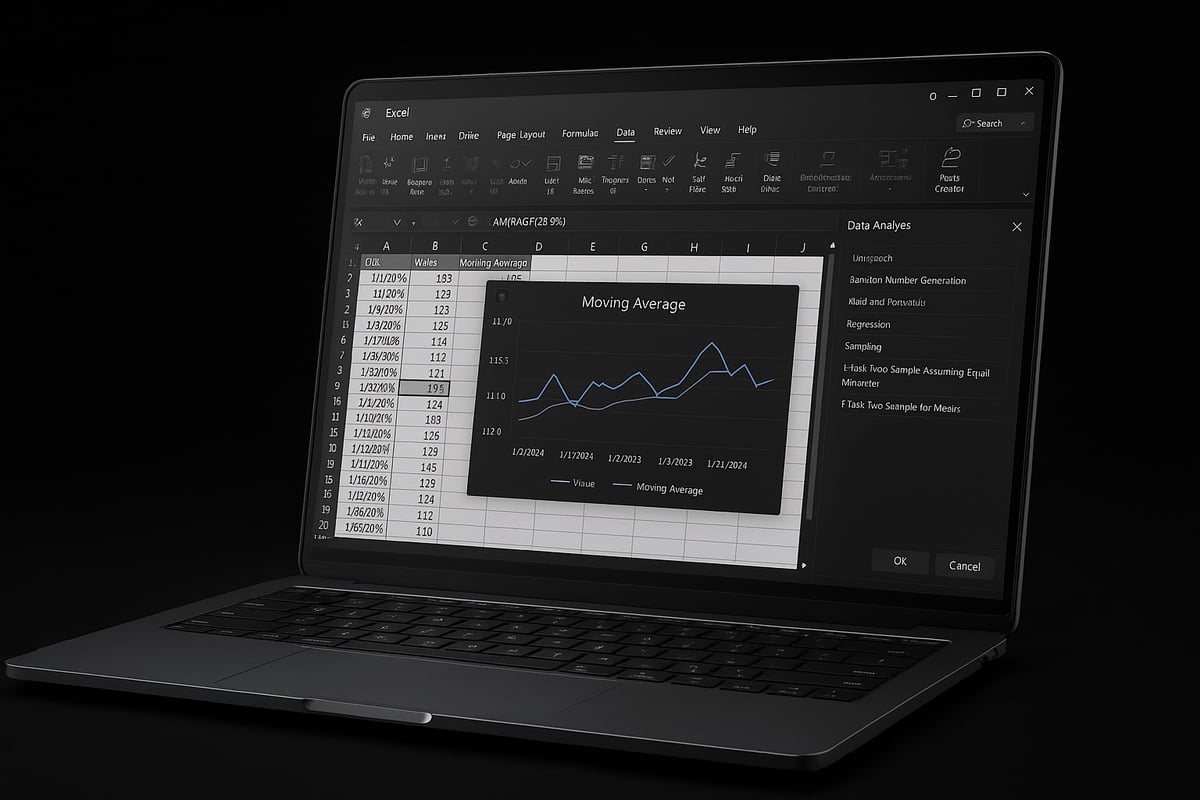
Using the Moving Average Feature
Now, let us walk through how to calculate moving average excel using the Data Analysis Toolpak:
- Click the
Datatab, then selectData Analysis. - In the dialog, choose
Moving Averageand clickOK. - For the Input Range, select your dataset column (e.g., B2:B31 for daily sales).
- Set the Interval to the number of periods you want to average (e.g., 3 for a 3-day moving average).
- Decide on the Output Range—you can select a cell in the current worksheet or choose
New Worksheet Plyfor a separate sheet. - Optionally, check
Chart Outputto generate a visual representation. - You can also select
Standard Errorsif you want error bars on your chart.
Here is a quick table summarizing your key inputs:
| Option | Description | Example |
|---|---|---|
| Input Range | Data to analyze | B2:B31 |
| Interval | Number of periods for averaging | 3 |
| Output Range | Where results will appear | C2 or new sheet |
| Chart Output | Adds a chart to your worksheet | Checked |
| Standard Errors | Shows error bars on the chart | Optional |
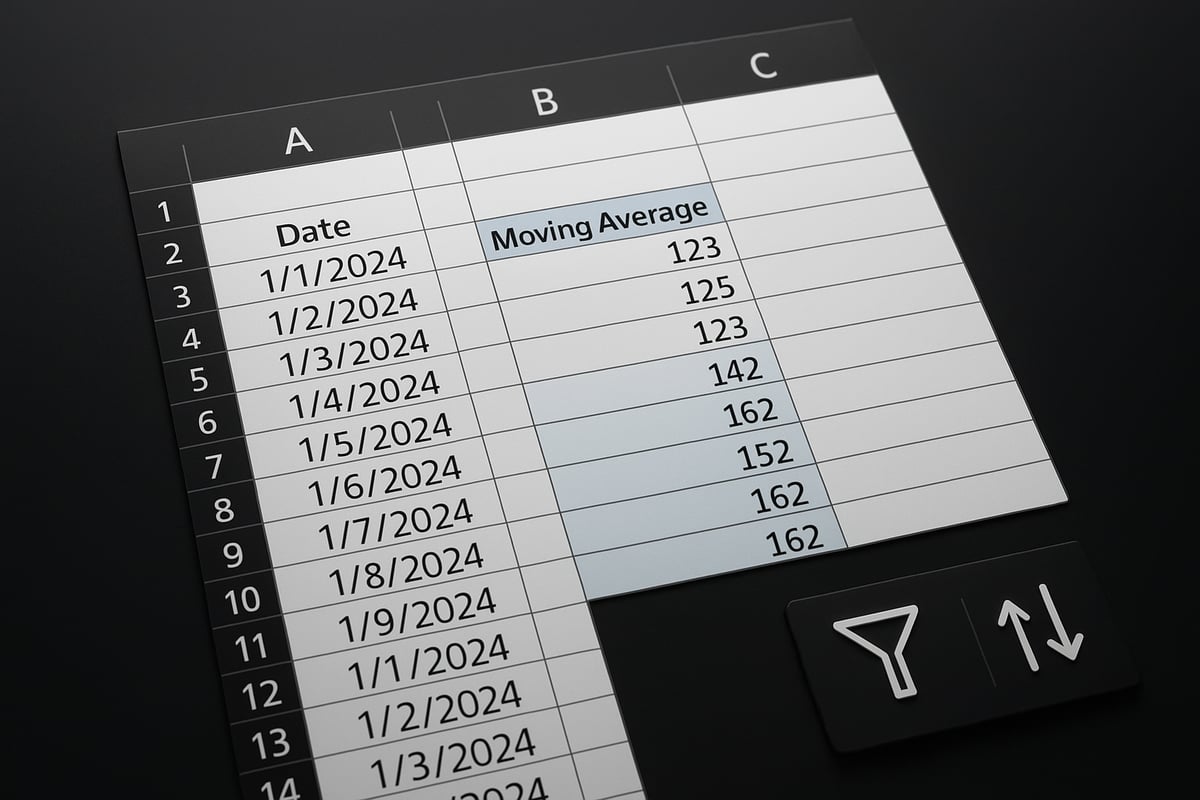
Practical Example: Calculating a 3-Day Moving Average
Suppose you have a column of daily sales data for a month. To learn how to calculate moving average excel for a 3-day period:
- Select your sales data as the Input Range.
- Set Interval to 3.
- Choose an Output Range adjacent to your data.
- Check Chart Output if you want a graph.
After clicking OK, Excel will display the moving averages next to your original data. The first two cells in the result will be blank, as there is not enough data to average for those points.
If you prefer manual calculation, enter this formula in cell C4 and drag it down:
=AVERAGE(B2:B4)
This simple formula gives you a rolling 3-day average. For more guidance, you can refer to this Calculate Moving Average in Excel resource, which outlines each step with visuals.
Handling Errors and Troubleshooting
Sometimes, while learning how to calculate moving average excel, you may encounter errors. Common issues include:
- #N/A or #VALUE! errors if your range includes text or insufficient data points.
- Misaligned output if the output range overlaps with your input data.
To fix these:
- Ensure your input range contains only numbers.
- Start your output range far enough to the right to avoid overwriting data.
- Adjust the interval to match the amount of available data.
If you see blanks or errors at the start of your output, this is normal. Excel cannot calculate a moving average until it has enough data points.
Interpreting and Validating Your Results
After you run the moving average calculation, review the output:
- Each result cell reflects the average of the current and previous (interval – 1) data points.
- The moving average column should align with your original data, lagging behind by the interval minus one.
- Use the chart output to visually confirm that trends are smoothed and patterns are easier to spot.
Double-check your input and output ranges to confirm accuracy. If the moving average seems off, review your interval and the consistency of your data.
Summary
Mastering how to calculate moving average excel empowers you to make sense of complex datasets. With the Data Analysis Toolpak, you can automate calculations, avoid manual errors, and visualize results in just a few clicks. Whether you use built-in features or manual formulas, moving averages reveal the story behind your numbers, supporting better business and research decisions.
Advanced Moving Average Techniques in Excel
Unlocking the full power of moving averages in Excel requires going beyond basic formulas. If you want to master how to calculate moving average excel for complex datasets, it is crucial to explore advanced techniques like weighted and exponential averages, automation with macros, and integrating results into dynamic dashboards.
Weighted and Exponential Moving Averages
When you need more nuanced analysis, understanding how to calculate moving average excel using weighted and exponential methods is essential. A simple moving average (SMA) treats all data points equally. However, a weighted moving average (WMA) assigns greater importance to recent data, making it ideal for time-sensitive trends. The exponential moving average (EMA) goes a step further by applying a smoothing factor, giving exponentially more weight to recent values.
To calculate a WMA in Excel, use the SUMPRODUCT and SUM functions. For example, if your data is in cells B2:B6 and your weights are in C2:C6, use:
=SUMPRODUCT(B2:B6, C2:C6)/SUM(C2:C6)
For an EMA, the formula is more complex. You start with an initial SMA, then apply:
= (Current Value * Smoothing Factor) + (Previous EMA * (1 - Smoothing Factor))
This approach responds quickly to new data, which is crucial for stock prices or volatile trends.
Here’s a comparison of the main moving average types:
| Type | Formula Example | Best Use Case |
|---|---|---|
| SMA | =AVERAGE(B2:B6) | Stable, slow-changing data |
| WMA | =SUMPRODUCT(B2:B6, C2:C6)/SUM(C2:C6) | Emphasize recent trends |
| EMA | Custom formula with smoothing factor | Fast-changing or volatile data |
For a deeper dive into advanced formulas and practical applications, see Leveraging Maths and Stats in Excel for Deeper Data Insights – Part 2.
These advanced methods help you refine how to calculate moving average excel for more accurate forecasting, especially when dealing with unpredictable or weighted datasets.
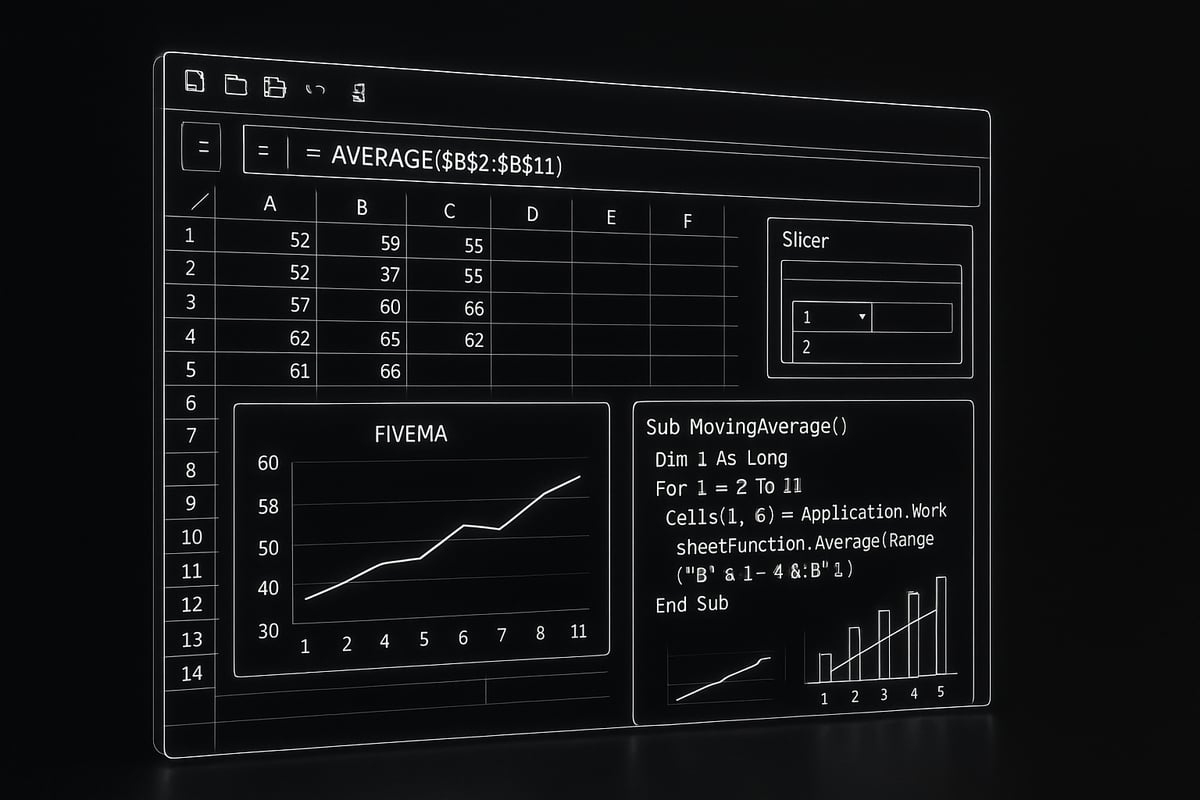
Automating Moving Average Analysis with Macros
When your workflow requires repetitive calculations or you handle massive datasets, automation can transform how to calculate moving average excel. VBA (Visual Basic for Applications) lets you write macros to automate moving average columns, apply formulas, and even generate charts in seconds.
A basic macro for a moving average might look like this:
Sub AddMovingAverage()
    Dim rng As Range
    Dim i As Integer
    Set rng = Range("B2:B101") ' Adjust as needed
    For i = 3 To rng.Rows.Count
        Cells(i, 3).Formula = "=AVERAGE(B" & i - 2 & ":B" & i & ")"
    Next i
End Sub
This macro calculates a 3-period moving average for each row and places the result in column C. You can modify the range and interval for your specific analysis.
Automation is particularly useful when you need to refresh calculations regularly or process multiple sheets. By leveraging macros, you streamline how to calculate moving average excel, boost productivity, and reduce manual errors.
Macros are also valuable for training teams or standardizing analytics across departments. With a well-written macro, even users with limited Excel experience can apply advanced moving averages to any compatible dataset.
Integrating Moving Averages with Excel Dashboards
To maximize insights, integrate your moving averages into interactive dashboards. With Excel 2026, you can display real-time trends using pivot tables, charts, slicers, and dynamic arrays. This approach makes it easy for stakeholders to explore data and spot patterns at a glance.
Start by adding your moving average calculations to your main dataset, then use a pivot table to summarize results. Insert line or column charts and add your moving average as a trendline for immediate visual impact. Slicers and filters allow users to adjust views by date, region, or product.
For example, a sales dashboard might show both daily figures and a 7-day moving average, helping managers identify short-term trends without being distracted by daily fluctuations.
To further streamline your workflow, consider using Excel templates for reports. Templates save setup time, ensure consistency, and allow you to focus on interpreting results rather than formatting data.
By embedding moving averages into dashboards, you make how to calculate moving average excel a core part of business intelligence, enabling faster, more informed decisions across your organization.
Expert Excel Tips and Best Practices for Moving Averages
Unlocking the full potential of moving averages in Excel requires more than just knowing the formulas. Mastering how to calculate moving average excel accurately involves careful planning, strategic use of features, and attention to detail. The following expert tips and best practices will help you achieve reliable results and streamline your analysis.
1. Choose the Right Interval for Your Data
Selecting the optimal interval is crucial when learning how to calculate moving average excel. The interval, or the number of periods included in the average, determines how much your data will be smoothed.
Shorter intervals (such as 3 or 5 days) react quickly to changes but may retain more noise. Longer intervals (10, 20 days or more) provide a smoother trend but can lag behind sudden shifts. Consider your dataset’s volatility: for highly variable data, use a longer interval to reduce noise; for stable data, a shorter interval may suffice.
2. Avoid Common Pitfalls
Mistakes like overlapping intervals, misaligned data, or improper formula references can undermine your analysis. For example, if your data range shifts or contains blanks, your moving average may become inaccurate. Always double-check your ranges and use absolute or relative references as needed.
Be mindful of errors such as #N/A or #VALUE! which can disrupt your calculations. If you encounter these, consult Troubleshooting Excel errors for step-by-step solutions tailored to moving average scenarios.
3. Leverage Excel 2026 Features and Templates
Excel 2026 introduces dynamic arrays, improved charting, and enhanced data visualization tools, making it easier than ever to calculate and present moving averages. Use dynamic arrays for rolling averages that automatically expand with your dataset.
Templates and reusable formulas save time and ensure consistency. Set up a master worksheet with labeled columns for your raw data, moving average calculations, and trend charts. This approach helps anyone reviewing your work understand exactly how to calculate moving average excel in your organization.
4. Document Your Calculations for Transparency
Clear documentation is essential, especially in collaborative environments. Use comments or a dedicated documentation worksheet to explain your moving average formulas, intervals chosen, and any assumptions made. This transparency supports auditability and future analysis.
5. Example: Weekly Moving Average Template
A well-structured template can make your workflow efficient. Here’s a simple setup for a weekly moving average:
| Date | Sales | 7-Day Moving Average |
|---|---|---|
| 2026-01-01 | 150 | |
| 2026-01-02 | 160 | |
| 2026-01-03 | 170 | |
| … | … | … |
| 2026-01-07 | 180 | =AVERAGE(B2:B8) |
Drag the moving average formula down to extend the calculation. Adjust the interval as needed for your data.
6. Keep Learning and Stay Current
Excel evolves rapidly, and so do best practices for moving average analysis. Explore academic research like Examining the Predictive Power of Moving Averages in the Stock Market to deepen your understanding of when and how to calculate moving average excel for different applications.
For ongoing improvement, follow reputable Excel blogs, attend webinars, and experiment with new features as they are released.
Applying these expert tips will not only help you avoid common mistakes but also empower you to deliver accurate, actionable insights from your data. Make best-practice moving average reporting part of your analytical toolkit, and your Excel skills will stand out in any business environment.