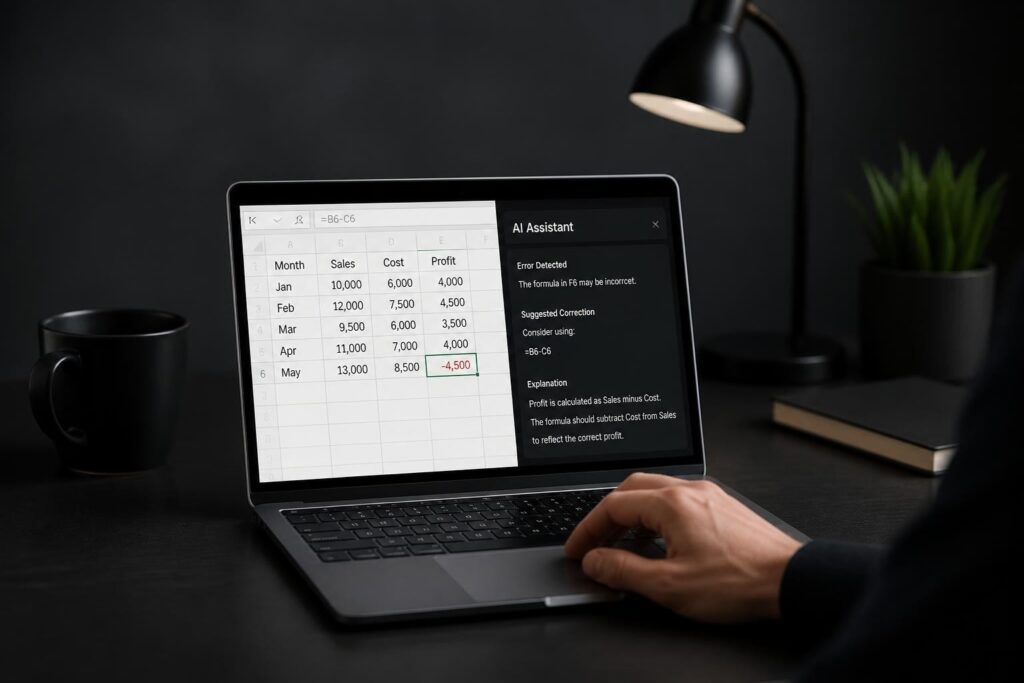
Generating reports manually in Excel consumes hours that could be spent on strategic analysis. Whether you're creating weekly sales summaries, monthly financial statements, or quarterly performance dashboards, the repetitive process of copying data, updating formulas, and reformatting cells drains productivity. Learning how to generate Excel reports automatically transforms this time-consuming task into a streamlined process that delivers consistent, error-free results. This comprehensive guide explores multiple automation methods, from basic Excel features to advanced AI-powered solutions, helping you choose the right approach for your specific reporting needs.
Understanding the Foundation of Excel Report Automation
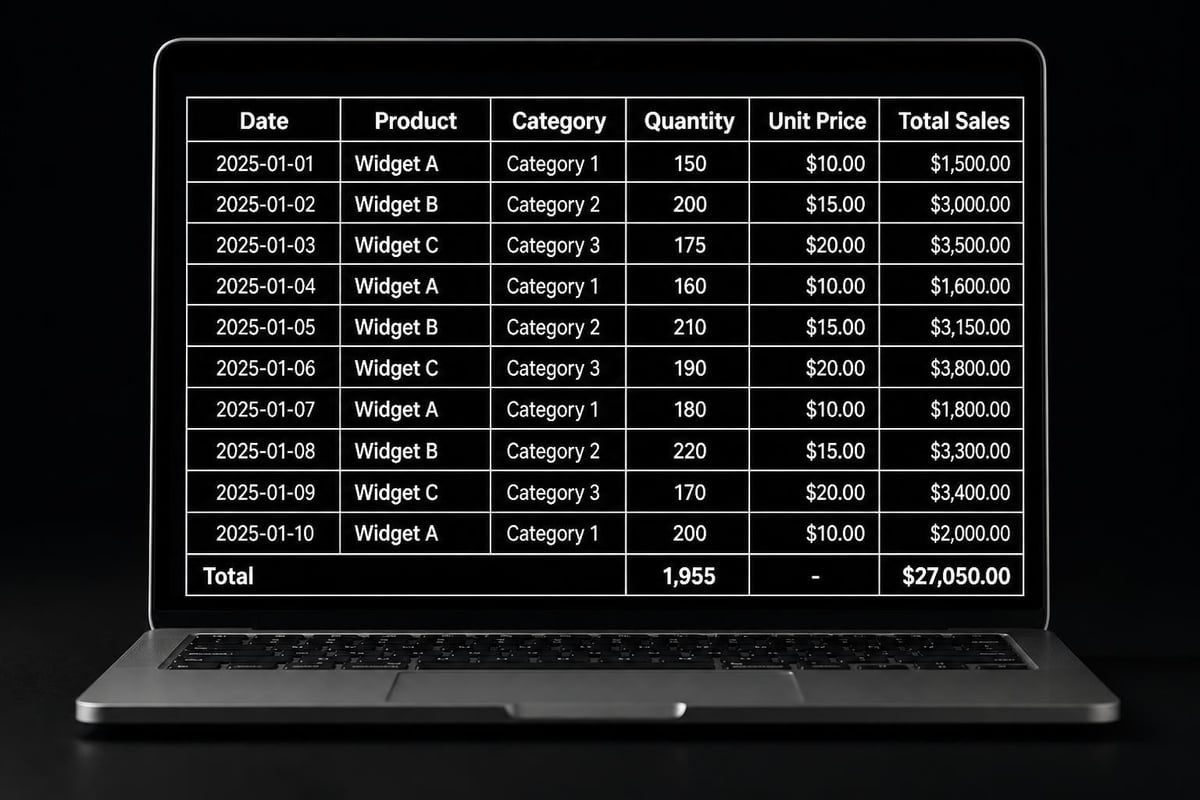
Before diving into automation techniques, you need to structure your data properly. Automated reporting systems depend on consistent data organization, clear naming conventions, and predictable file structures.
Setting Up Your Data Infrastructure
Your source data should follow database principles. Each column represents a single variable, each row contains one record, and headers remain in the first row. Avoid merged cells, blank rows, or embedded subtotals within your data range.
Key infrastructure elements include:
- Dedicated data tables with structured references
- Named ranges for critical data sources
- Consistent file naming conventions
- Standardized date and number formats
- Central data repository locations
When your foundation is solid, automation tools can reliably locate, extract, and process information without manual intervention. This preparation phase prevents the common failures that plague automated reporting systems.
Automating Reports with Power Query
Power Query provides a user-friendly interface for how to generate Excel reports automatically without writing code. This built-in Excel tool connects to multiple data sources, transforms information through repeatable steps, and refreshes with a single click.
Building Your First Automated Query
Access Power Query through the Data tab by selecting "Get Data" from the relevant source. Whether you're importing from another Excel file, a database, or a web source, Power Query records every transformation step.
Common transformations include filtering rows, removing duplicates, splitting columns, pivoting data, and merging queries. Each action appears in the Applied Steps pane, creating a transparent audit trail of your data processing.
| Power Query Function | Use Case | Automation Benefit |
|---|---|---|
| Filter Rows | Remove irrelevant records | Consistent data subset |
| Group By | Calculate summaries | Automated aggregations |
| Merge Queries | Combine data sources | Single refresh updates all |
| Append Queries | Stack similar datasets | Growing data handled automatically |
| Custom Columns | Add calculated fields | Formulas apply to new data |
Once configured, refreshing your query updates the entire report with new data. The comprehensive guide on automating Excel report generation demonstrates how Power Query handles complex multi-source scenarios effectively.
Advanced Power Query Techniques
Parameters allow your queries to accept dynamic inputs like date ranges or department names. Create parameters through the Manage Parameters option, then reference them in your filter steps using the dropdown selector.
Conditional columns add logic-based transformations. For example, categorize sales amounts into "High," "Medium," or "Low" tiers automatically based on threshold values you define once.
VBA Macros for Complete Report Automation
Visual Basic for Applications (VBA) enables complete control over how to generate Excel reports automatically. While more technical than Power Query, VBA handles complex formatting, multi-sheet operations, and conditional logic that simpler tools cannot manage.
Creating Your First Report Macro
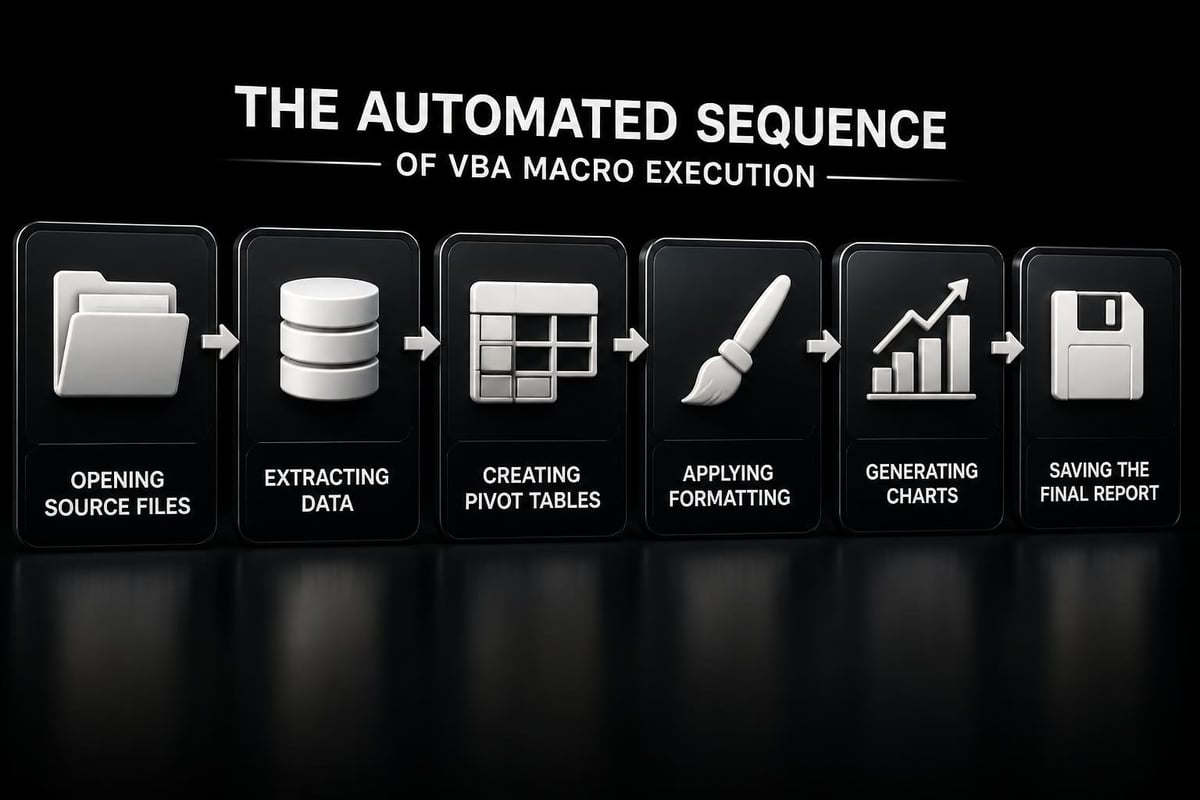
Open the Visual Basic Editor by pressing Alt+F11. Insert a new module through Insert > Module, then write your automation code. A basic report macro might pull data from a source sheet, create pivot tables, apply formatting, and generate charts.
Essential VBA objects for report automation:
- Workbooks – Open, close, and save files programmatically
- Worksheets – Add, delete, copy, and rename sheets
- Range – Manipulate cell values, formulas, and formats
- PivotTables – Create and refresh dynamic summaries
- Charts – Generate visualizations based on data ranges
Record macros to learn VBA syntax quickly. Start the macro recorder, perform your reporting tasks manually, then examine the generated code. Edit and optimize this code to create efficient automation routines.
Error handling prevents crashes when source data changes unexpectedly. Use On Error Resume Next for simple scenarios or structured error handling with On Error GoTo for production-level automation. Our Microsoft Excel consulting services help organizations implement robust VBA solutions with proper error management.
Scheduling VBA Report Generation
Task Scheduler in Windows can trigger Excel to open and run macros automatically. Create a VBA procedure that executes on workbook open, performs your report generation, saves the file, and closes Excel. Then schedule the workbook to open at your desired frequency.
For the workbook to run macros automatically, add this code to the ThisWorkbook module:
Private Sub Workbook_Open()
    Call GenerateReport
    ThisWorkbook.Save
    Application.Quit
End Sub
This approach works excellently for daily, weekly, or monthly reports that follow consistent patterns.
Power Automate for Cloud-Based Report Generation
Microsoft Power Automate extends automation beyond Excel's boundaries, connecting your reports to SharePoint, Outlook, Teams, and hundreds of other services. This cloud-based approach to how to generate Excel reports automatically excels when data comes from multiple systems or reports need distribution to various stakeholders.
Building a Power Automate Flow
Start with a trigger that initiates your report generation. Common triggers include scheduled recurrence, new items in SharePoint lists, email arrivals, or form submissions. The tutorial on creating Excel files with Power Automate shows practical implementation steps for dynamic report generation.
Actions define what happens after the trigger fires. You might query a database, filter records, create an Excel file, populate rows, apply formulas, and email the finished report to recipients.
Combining Power Automate with Excel Templates
Create a template workbook containing your desired formatting, formulas, and chart structures. Store this template in OneDrive or SharePoint. Your Power Automate flow copies the template, populates data ranges, refreshes calculations, and saves the completed report with a timestamped filename.
| Component | Template Role | Automation Role |
|---|---|---|
| Headers & Labels | Pre-formatted, branded | Never changes |
| Formulas | Reference standard ranges | Calculate automatically |
| Charts | Linked to data ranges | Update with new data |
| Conditional Formatting | Rules defined once | Apply to all new data |
| Print Settings | Page layout configured | Reports print-ready |
This separation between structure and data ensures consistent report appearance while content updates automatically. Learn more about Excel workflow automation with AI for enhanced Power Automate capabilities.
AI-Powered Report Automation
Artificial intelligence brings natural language interfaces and intelligent decision-making to how to generate Excel reports automatically. Modern AI tools can interpret instructions, clean messy data, suggest optimal visualizations, and even write complex formulas.
Using AI Assistants for Report Generation
Tools like Microsoft Copilot for Excel allow you to describe your desired report in plain language. Request "Create a monthly sales summary showing revenue by product category with year-over-year comparison" and watch as the AI generates the appropriate pivot table, calculations, and formatting.
The research on AI-powered document creation demonstrates how virtual assistants can generate financial reports through natural language interactions, reducing technical barriers for non-programmers.
AI capabilities for report automation:
- Data cleaning and standardization
- Automatic outlier detection
- Intelligent column type recognition
- Formula generation from descriptions
- Chart type recommendations
- Natural language querying of data
Our guide on automating Excel reporting with AI explores specific tools and implementation strategies for various business scenarios.
AI-Enhanced Data Processing
AI excels at handling inconsistent data that traditional automation struggles with. When vendor names appear with variations (Microsoft, MSFT, Microsoft Corp), AI can standardize these automatically by understanding context rather than requiring exact pattern matching.
For Excel data cleaning with AI, you can process thousands of records that would take hours manually. The AI identifies duplicates with fuzzy matching, fills missing values intelligently, and suggests corrections for obvious errors.
Implementing Python for Advanced Report Automation
Python libraries like pandas, openpyxl, and xlwings provide powerful capabilities for how to generate Excel reports automatically when requirements exceed Excel's native features. Python handles large datasets efficiently, performs complex statistical analysis, and integrates with virtually any data source.
Setting Up Python for Excel Automation
Install Python and the necessary libraries using pip. The openpyxl library reads and writes Excel files directly, while pandas provides data manipulation capabilities, and xlwings allows Python to control Excel like VBA but with Python's extensive ecosystem.
A basic Python script opens a data source, performs transformations using pandas DataFrames, creates an Excel writer object, and outputs formatted worksheets with charts and conditional formatting.
Advantages of Python-Based Automation
Unlike VBA, Python code runs independently of Excel, meaning reports can generate on servers without Excel installed. This enables true backend automation where reports are created on-demand or on schedule without any desktop interaction.
Python's extensive library ecosystem connects to databases, APIs, cloud storage, and data warehouses seamlessly. You can pull data from Salesforce, transform it with pandas, combine it with database queries, and output a comprehensive Excel report in a single script.
The benchmark for generating Excel scripts from natural language highlights how modern AI tools can write Python automation code from simple descriptions, making this approach accessible to less technical users.

Building Sustainable Report Automation Systems
Creating a report that works once differs dramatically from building a sustainable system that runs reliably for years. Sustainable automation requires documentation, error handling, version control, and maintenance planning.
Documentation Best Practices
Every automated report needs clear documentation explaining its purpose, data sources, update frequency, and troubleshooting steps. When you're on vacation and the report fails, someone else should be able to diagnose and fix the issue.
Essential documentation elements:
- Report purpose and audience
- Data source locations and access requirements
- Update schedule and trigger conditions
- Step-by-step process flow
- Known limitations and edge cases
- Change history and version notes
- Contact information for support
Store documentation alongside your automation files in a shared location. Consider using markdown files that version control systems can track, making it easy to see how processes evolve over time.
Monitoring and Maintenance
Automated reports fail silently if not monitored properly. Implement checks that verify data freshness, validate calculation results, and alert stakeholders when issues occur. A report showing last month's data when it should display this month's information causes worse problems than no report at all.
Schedule quarterly reviews of all automated reports. Check whether business requirements have changed, data sources remain stable, and performance stays acceptable as data volumes grow. Proactive maintenance prevents emergency fixes.
Choosing the Right Automation Method
Different scenarios demand different approaches to how to generate Excel reports automatically. A simple weekly sales summary requires different tools than a complex financial consolidation pulling from multiple systems.
| Scenario | Recommended Method | Key Consideration |
|---|---|---|
| Single data source, simple formatting | Power Query | Easiest maintenance |
| Complex multi-step processing | VBA Macros | Full control |
| Cloud data sources, email distribution | Power Automate | Integration capabilities |
| Very large datasets (100K+ rows) | Python | Performance |
| Natural language requirements | AI Tools | User accessibility |
| Real-time dashboards | Combination approach | Refresh speed |
Start with the simplest method that meets your requirements. Power Query handles approximately 80% of report automation needs without any coding. Reserve VBA, Python, and AI tools for scenarios where simpler approaches fall short.
Consider who will maintain the system long-term. If your IT department doesn't support VBA, a Power Automate solution might prove more sustainable despite being slightly less capable. The guide on automated report creation explores integration-based approaches that reduce technical debt.
Optimizing Report Performance
As data volumes grow and report complexity increases, performance becomes critical. Users won't trust automated reports that take 30 minutes to refresh or crash with memory errors.
Performance Optimization Techniques
Limit data ranges to necessary information only. Pulling complete historical datasets when you only need the current month wastes processing time and memory. Use filters in Power Query or WHERE clauses in database queries to reduce data volume before it enters Excel.
Additional optimization strategies:
- Disable automatic calculation during VBA execution
- Use arrays instead of cell-by-cell operations
- Index and optimize source database tables
- Break large reports into smaller modules
- Archive historical data to separate files
- Use Excel tables instead of unstructured ranges
Formula efficiency matters significantly. SUMIFS performs better than array formulas in most scenarios. VLOOKUP against sorted data with TRUE parameter runs faster than VLOOKUP with FALSE. Understanding these nuances prevents performance degradation as reports scale.
For AI-powered Excel dashboard creation, performance optimization becomes critical since dashboards often refresh frequently and need responsive user experiences.
Security Considerations for Automated Reports
Automated reports often contain sensitive financial, customer, or strategic information. Implementing proper security measures protects your organization while maintaining automation efficiency.
Access Control and Data Protection
Store source data and automated workbooks in secure locations with appropriate access controls. SharePoint and OneDrive offer granular permissions that allow automation services to access files while restricting human access to authorized personnel only.
Encrypt workbooks containing sensitive information using Excel's built-in protection features. For VBA-based automation, protect your code to prevent unauthorized modifications while documenting the password in your secure password management system.
Security layers for automated reports:
- Network folder permissions
- Excel workbook passwords
- VBA project protection
- Data connection encryption
- Audit logging of access
- Regular permission reviews
When distributing automated reports via email, consider using secure file-sharing links instead of attachments. This approach allows you to revoke access later if needed and provides audit trails of who viewed the report.
Testing Your Automated Reports
Thorough testing prevents embarrassing errors like emailing last quarter's numbers to executives or displaying incorrect calculations to clients. Treat report automation like software development with structured testing phases.
Creating a Testing Framework
Develop a test dataset with known values and expected results. Run your automated report against this test data and verify every calculation, chart, and formatted element produces the correct output. This baseline test catches formula errors and logic problems.
Test edge cases including empty datasets, single-record datasets, maximum values, and boundary conditions. If your report categorizes sales as "Low" under $10,000 and "High" above $10,000, test values of exactly $10,000 to verify proper handling.
User acceptance testing involves stakeholders reviewing the automated report output for accuracy, completeness, and usability. They often catch issues that technical testing misses, like unclear labels or missing contextual information.
Maintain a testing checklist for each report that documents all scenarios validated before deployment. Rerun these tests whenever you modify the automation logic or source data structures change.
Scaling Report Automation Across Organizations
Individual report automation delivers value, but organization-wide implementation multiplies benefits exponentially. Scaling requires standardization, governance, and knowledge sharing.
Establishing Automation Standards
Create templates and frameworks that teams can adapt for their specific needs. Standard Power Query functions, VBA modules, or Python libraries reduce development time and ensure consistent quality across all automated reports.
Define naming conventions for files, data ranges, queries, and automation components. When everyone follows the same patterns, troubleshooting becomes easier and knowledge transfers smoothly between team members.
Organizational automation components:
- Centralized data source catalog
- Shared code library repository
- Standard report templates
- Automation request process
- Training materials and resources
- Support escalation procedures
For organizations looking to implement comprehensive automation strategies, business intelligence consulting services provide expert guidance on building scalable, maintainable systems.
Consider creating a center of excellence that develops automation solutions, provides training, and supports business units. This centralized expertise prevents redundant development and ensures best practices propagate throughout the organization.
Troubleshooting Common Automation Issues
Even well-designed automated reports encounter problems. Knowing how to diagnose and resolve common issues minimizes downtime and maintains stakeholder confidence.
Frequent Problems and Solutions
Data source path changes rank as the most common automation failure. When files move locations or database connection strings change, automated reports break. Use relative paths where possible and document all external dependencies clearly.
| Problem | Symptom | Solution |
|---|---|---|
| Broken data links | #REF errors, missing data | Update connection strings |
| Formula errors | #VALUE, #DIV/0 | Add error handling formulas |
| Timeout issues | Report hangs indefinitely | Optimize queries, reduce data volume |
| Format inconsistencies | Different layouts each run | Use templates, structured ranges |
| Permission failures | Cannot access source files | Verify service account credentials |
Date handling causes numerous automation problems. Regional settings differences between the automation server and development computer can shift dates by entire months when Excel interprets "3/4/2026" as April 3rd instead of March 4th. Always use unambiguous date formats (YYYY-MM-DD) in source data.
The AI tools for business analysts using Excel can help identify and resolve complex formula errors that traditional debugging struggles to catch.
Continuous Improvement of Automated Reports
Automation isn't a one-time implementation project. Regular enhancements keep reports relevant, efficient, and valuable as business needs evolve.
Gathering User Feedback
Schedule regular feedback sessions with report consumers. Ask what additional insights would help their decision-making, which sections they find most valuable, and what information never gets used. This input guides meaningful improvements rather than technical enhancements that don't add business value.
Track report usage metrics when possible. If certain sections are consistently ignored, consider removing them to simplify maintenance. If users export specific data for further analysis, incorporate those analyses directly into the automated report.
Monitor execution times, failure rates, and resource consumption. Degrading performance indicates the need for optimization or architectural changes before problems become critical.
Stay current with Excel features and automation tools. Microsoft continually enhances Power Query, adds AI capabilities, and improves performance. Annual reviews of your automation infrastructure identify opportunities to leverage new features that simplify maintenance or expand capabilities.
Mastering how to generate Excel reports automatically transforms time-consuming manual processes into efficient systems that deliver consistent, accurate results with minimal ongoing effort. Whether you choose Power Query for simplicity, VBA for control, Power Automate for integration, or AI for intelligence, the right automation approach saves countless hours while reducing errors that plague manual reporting. If your organization needs expert guidance implementing robust report automation systems, The Analytics Doctor specializes in diagnosing spreadsheet problems and creating custom automation solutions tailored to your specific requirements, ensuring your data works smarter for your business.