Are you finding it challenging to navigate massive spreadsheets in Excel? With data growing bigger every year, mastering efficient tools is more important than ever.
This expert guide will show you how to filter in excel, ensuring you can quickly extract the information you need, minimize errors, and streamline your workflow using the most up-to-date 2026 features.
You will learn the core basics, explore advanced filter options, solve common filtering issues, and apply practical techniques for both business and personal productivity. Get ready to transform the way you work with data by following proven strategies from Excel experts.
Understanding Filtering in Excel: The Basics
Filtering is a foundational skill for anyone working with data, and knowing how to filter in excel is essential for uncovering insights quickly. At its core, filtering allows users to display only the rows in a dataset that meet specific criteria, hiding the rest from view. This targeted approach streamlines analysis and helps professionals focus on what matters most within large, complex spreadsheets.
In 2026, Excel’s filtering capabilities have evolved to offer even more power and flexibility. Microsoft has enhanced the filter interface with faster dropdowns, smarter search functions, and improved multi-select features. These updates build on previous versions, making it easier to find relevant data in seconds. Filtering is now more intuitive, especially for users managing thousands of rows or collaborating on shared workbooks.
Excel provides several types of filters to suit different needs. Here is a quick comparison:
| Filter Type | Purpose | Typical Use Case |
|---|---|---|
| AutoFilter | Quick, column-based filtering | Basic data review |
| Custom Filter | Filtering with specific rules | Filtering by date ranges, text |
| Advanced Filter | Complex, multi-criteria logic | Extracting unique records, cross-sheet filtering |
Understanding how to filter in excel means knowing when to use each option. AutoFilter is perfect for everyday tasks, while Advanced Filter unlocks more sophisticated scenarios.
It’s important to distinguish filtering from sorting. Sorting rearranges all data based on selected columns, such as ordering sales from highest to lowest. Filtering, on the other hand, temporarily hides rows that don’t match your criteria, without changing the order of your data. Both are essential tools, but they serve distinct purposes in analysis.
Consider a practical example: You have a year’s worth of sales data and want to identify your top-performing products. By applying a filter to show only items with sales above a certain threshold, you can instantly focus on the products driving your business forward. This method is not only efficient but also reduces the risk of missing critical trends.
Statistics highlight the importance of knowing how to filter in excel. According to Microsoft, more than 70% of Excel users rely on filters every week. Filtering is crucial in diverse fields such as finance, HR, and marketing. Financial analysts isolate expense categories, HR teams filter employee records by department, and marketers segment campaign data to measure performance.
To get the most accurate results, your data must be clean and well-structured. Issues like blank rows, inconsistent data types, or invalid entries can disrupt filtering. Implementing Excel data validation rules ensures your data is ready for robust analysis, paving the way for more reliable filter results.
While basic filtering solves many challenges, it does have limitations. Filters may not capture complex conditions or unique values across multiple columns. When your analysis demands more, exploring advanced options like custom criteria and formula-based filters becomes essential. Mastering how to filter in excel is the foundation, but leveraging advanced tools will unlock even greater productivity.
Step-by-Step: How to Apply Filters in Excel
Filtering data is a core skill for anyone working in Excel. Understanding how to filter in excel can help you quickly find the information you need, minimize errors, and transform how you analyze large datasets.
Step 1: Prepare Your Data
Before you start, make sure your data is organized. Remove any blank rows or columns and ensure each column has a clear, unique header. Consistent formatting is crucial for filters to work correctly.
Step 2: Enable AutoFilter
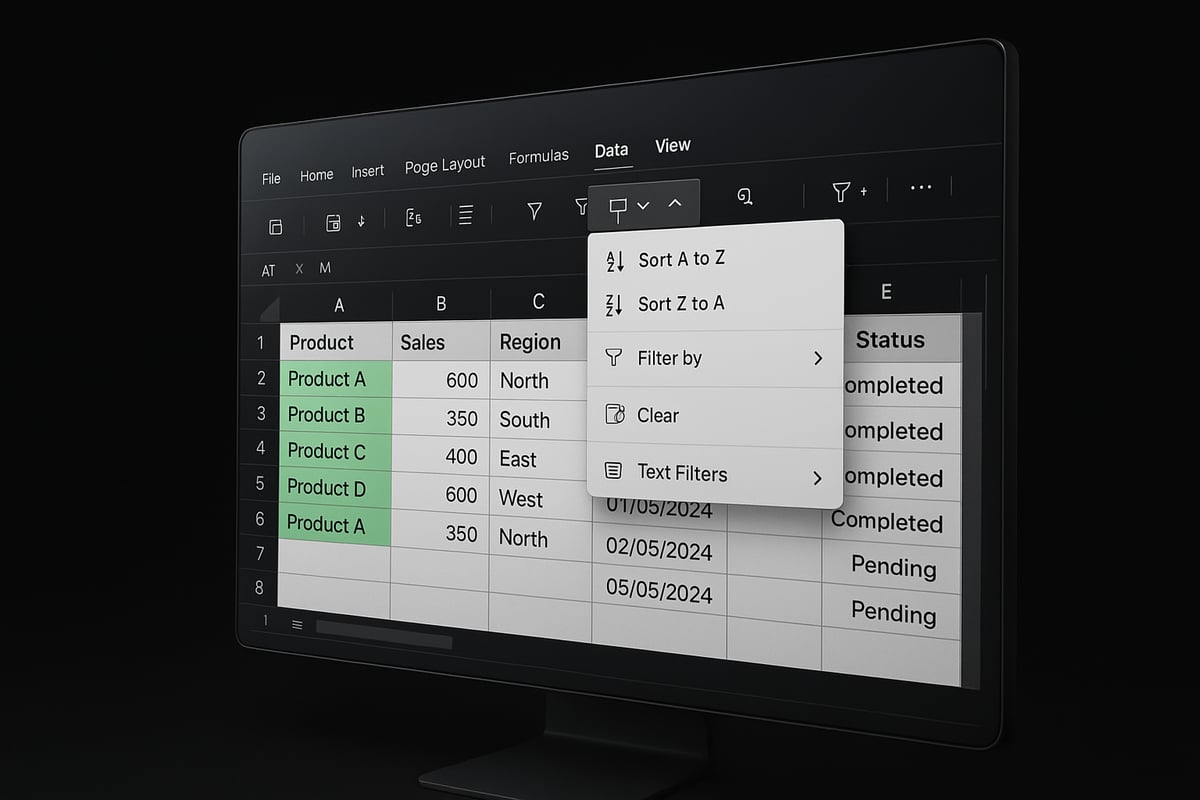
Select your data range or click inside your table. Go to the Home or Data tab, then click Filter. This will add filter dropdown arrows to each column header. Knowing how to filter in excel starts with this essential step.
Step 3: Use Dropdown Arrows to Filter
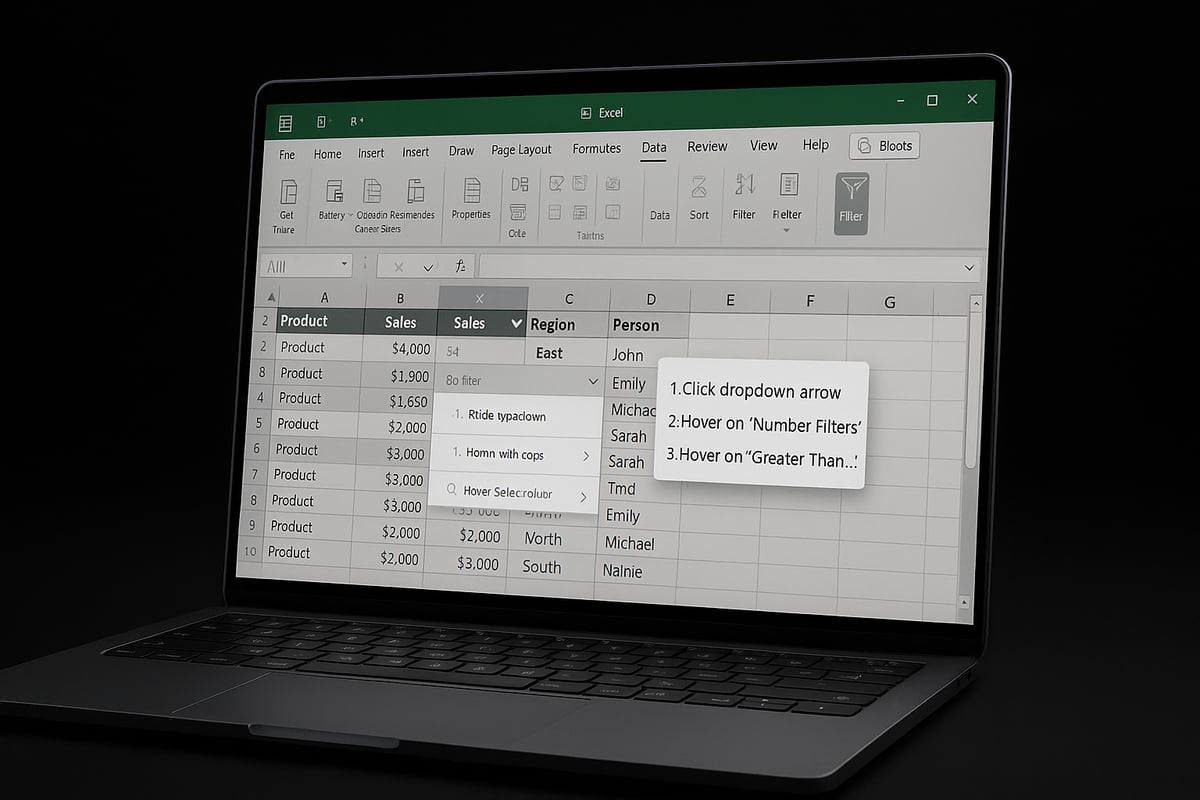
Click the dropdown arrow next to any column header. You can filter by value, text, number, or date. For example, filter your sales data to only show transactions from a specific region or month.
| Column | Sample Data |
|---|---|
| Customer | John Smith |
| Region | West |
| Purchase Date | 2026-05-01 |
| Amount | $2,000 |
Using these dropdowns, you can select or deselect specific values, use text filters (like "contains" or "begins with"), or set date ranges. This is the core of how to filter in excel for targeted analysis.
Step 4: Apply Multiple Filters Across Columns
Excel allows you to apply filters to several columns at once. For instance, filter your customer list by both region and purchase date to find clients in the West who bought in May 2026. Stacking filters narrows your results for deeper insights.
Step 5: Clear Filters and Restore Data
To remove a filter, click the filter icon in the column header and select Clear Filter From…. To remove all filters at once, click the Filter button again in the Data tab. This instantly restores your full dataset view.
Step 6: Save Filtered Views
For recurring analysis, save your filtered view. You can copy filtered data to a new sheet or use Excel’s “Custom Views” to save and quickly recall filter settings. This is especially helpful for weekly or monthly reports.
Example: Filtering a Customer List
Suppose you have a customer list with thousands of entries. To find all customers from Texas who purchased in Q2 2026, apply a filter to the State column for “TX” and the Purchase Date column for dates between April and June. This targeted approach is a practical use of how to filter in excel.
Pro Tip: Use Keyboard Shortcuts
Speed up your workflow with shortcuts. Press:
Ctrl + Shift + L
This toggles filters on or off instantly. Mastering these shortcuts can save significant time, especially when working with large datasets.
Efficiency Gains
According to recent Excel user surveys, using filters can reduce data processing time by up to 60%. That is why learning how to filter in excel is a game-changer for productivity.
Want to explore more ways to refine your data? Check out these Filtering Techniques for Excel Data to discover additional strategies and best practices.
With these steps, you are equipped to filter in Excel like a pro. Practice regularly, and soon filtering will become second nature in your daily workflow.
Advanced Filtering Techniques for Power Users
Unlocking the full potential of how to filter in excel means going beyond the basics. Advanced filtering empowers users to create targeted views, automate complex selections, and boost reporting accuracy. In 2026, mastering these techniques is vital for professionals who need precise, actionable insights from large datasets.
Using Logical Operators and Custom Criteria
When learning how to filter in excel at an advanced level, logical operators like AND, OR, and NOT allow you to combine multiple conditions. For example, you can filter sales records where product type is "Electronics" AND sales exceed $1,000. In the Advanced Filter dialog, enter criteria in adjacent rows for AND logic, or stack them vertically for OR logic.
Custom criteria can include numeric ranges, specific dates, or text patterns. For instance, filter employees with tenure greater than 3 years but less than 10 by setting respective criteria in your filter range. This approach ensures you extract only the most relevant data subsets for your analysis.
Complex Filters with Formulas, Expressions, and Wildcards
Advanced users often need to filter data based on formulas or partial matches. With how to filter in excel, you can use expressions such as =LEFT(Name,1)="A" to filter customers whose names start with "A." Wildcards like * and ? help find partial text matches, such as filtering all product codes beginning with "QTR*."
Combining formulas with filters lets you handle scenarios such as extracting all transactions above a certain threshold or those matching a pattern. Excel's Advanced Filter supports criteria based on calculated fields, enabling even more granular control. For a comprehensive guide, consider reviewing Excel’s Advanced Filtering Techniques for step-by-step strategies.
Filtering Unique Values and Removing Duplicates
Another crucial aspect of how to filter in excel is isolating unique entries or removing duplicates. The Advanced Filter can extract unique records from a dataset, which is essential for de-duplicating customer lists or inventory logs.
To remove duplicates, select your data, use the Advanced Filter, and check the "Unique records only" option. For a detailed walkthrough, visit How to remove duplicate records, which covers practical steps and troubleshooting tips. This process not only cleans up data but also improves reporting accuracy by up to 25%, according to recent business studies.
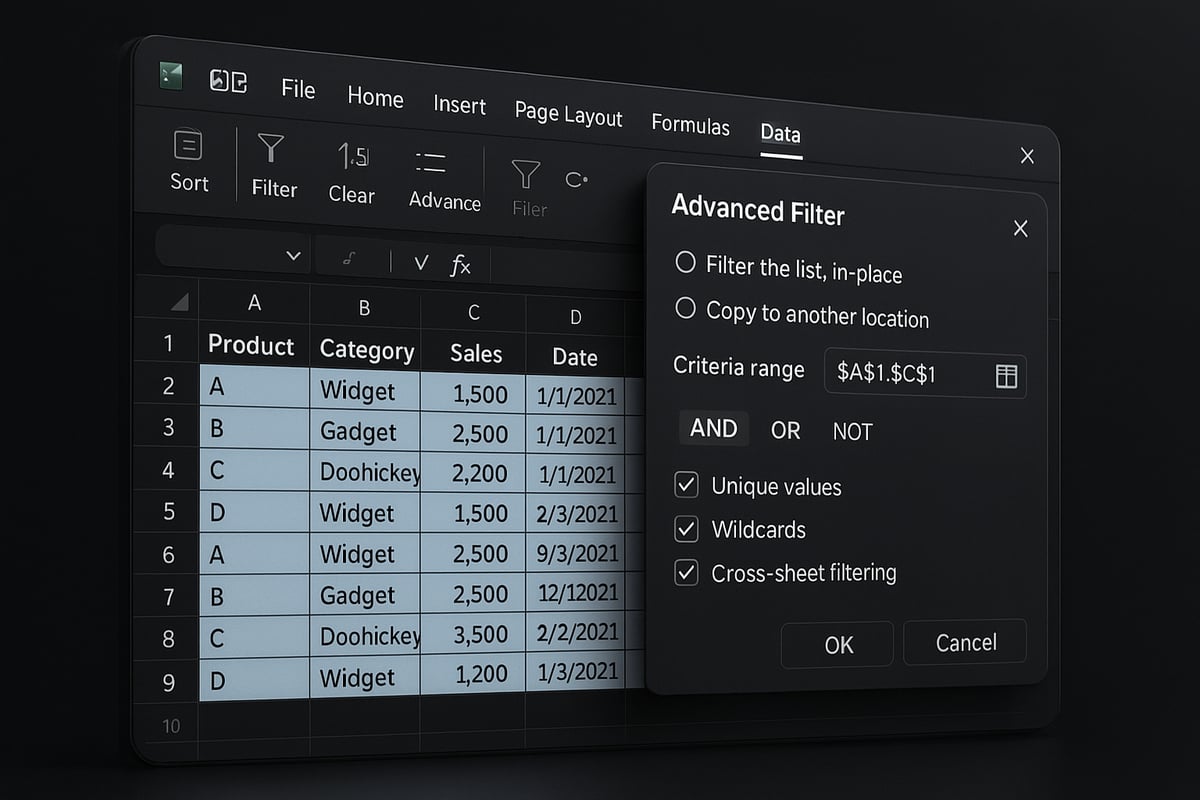
Cross-Sheet Filtering with the Advanced Filter Dialog Box
The Advanced Filter dialog box is a powerful tool for cross-sheet filtering. If you need to filter data from one worksheet and display the results on another, the dialog box allows you to specify both the list range and the criteria range on separate sheets.
This approach is invaluable when building consolidated reports or dashboards. For example, filter all orders from a master sales sheet and output only those meeting your criteria to a summary sheet. This keeps your workflows organized and your results easy to share.
Combining Filters with Conditional Formatting for Visual Analysis
Pairing how to filter in excel with conditional formatting adds a visual layer to your analysis. After applying an advanced filter, use conditional formatting rules to highlight trends, outliers, or priority records. For example, automatically shade filtered rows where revenue exceeds targets, or flag overdue tasks in a project tracker.
This integration transforms filtered data into actionable insights at a glance. It also enhances team collaboration by making key findings more visible and understandable. Advanced filters, combined with formatting, are essential tools for turning raw data into strategic business decisions.
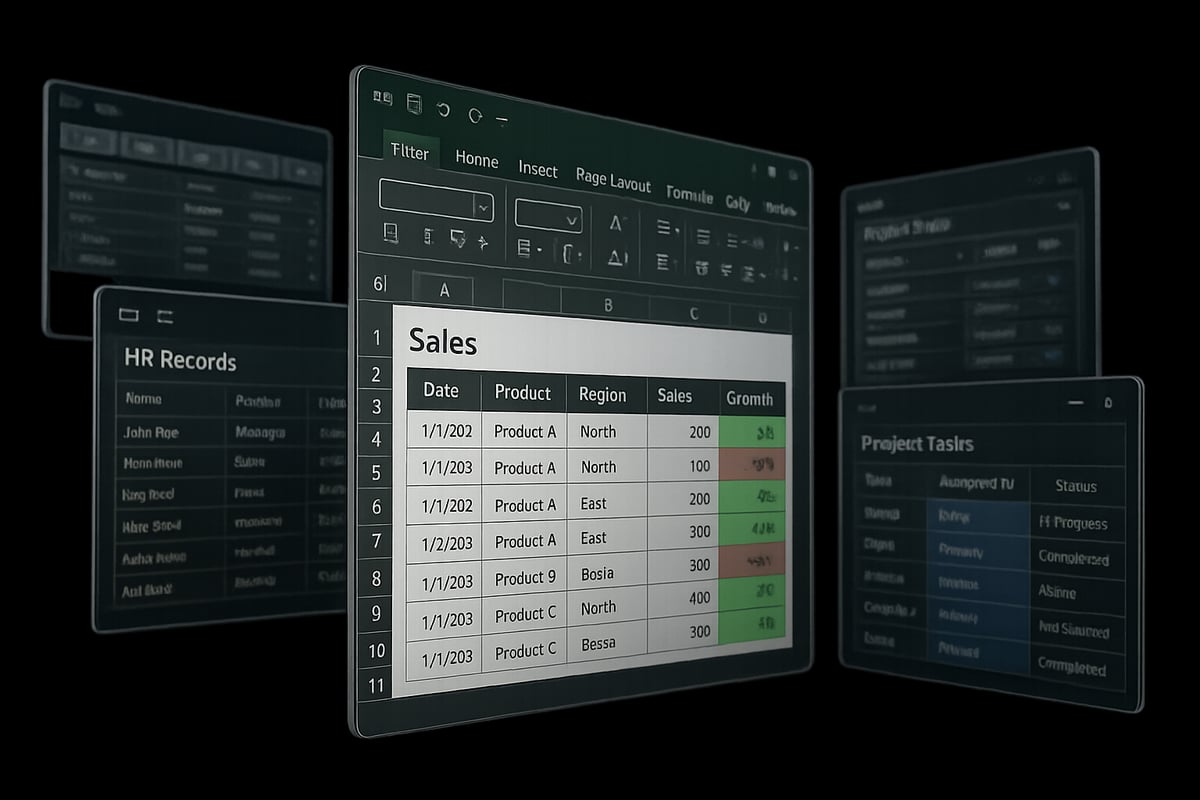
Practical Applications: Filtering for Business and Productivity
Filtering data in Excel is crucial for professionals seeking clarity and efficiency. Mastering how to filter in excel empowers teams to extract meaningful insights, streamline reporting, and make informed decisions faster.
Filtering for Financial Analysis
Finance teams rely on how to filter in excel to track expenses, isolate revenue streams, and detect anomalies quickly. For example, filtering transaction data by date and amount can help analysts spot irregularities in spending or highlight top revenue sources.
A common scenario involves filtering a general ledger to show only transactions above a certain threshold. This technique streamlines budget reviews and simplifies audit preparation.
HR: Organizing Employee Data
In human resources, how to filter in excel is essential for managing large employee datasets. HR professionals can filter staff lists by department, tenure, or performance ratings to support strategic planning.
For instance, filtering for employees with upcoming work anniversaries enables targeted recognition programs. Similarly, isolating high-performers helps in succession planning and training allocation.
Marketing: Segmenting Campaign Data
Marketers use how to filter in excel to segment leads, analyze campaign results, and tailor outreach. By filtering contact lists by engagement level or region, teams can prioritize follow-ups and optimize advertising spend.
Filtering campaign performance data by channel or demographic allows marketers to focus on the most effective strategies. This targeted approach boosts ROI and enhances customer engagement.
Project Management: Task Tracking
Project managers benefit from knowing how to filter in excel when tracking tasks by status, owner, or deadline. Filtering a project plan to show only overdue tasks or items assigned to a specific team member streamlines meetings and keeps projects on track.
By combining filters with progress indicators, managers get a clear snapshot of project health and can allocate resources efficiently.
Case Study: Texas Business Transformation
A Texas-based company recently improved reporting speed by 40% after implementing advanced filtering techniques in Excel. By learning how to filter in excel with multiple criteria, the team automated weekly sales reports and reduced manual work.
They also leveraged Create a PivotTable in Excel to combine filters with interactive summaries, enabling faster decision-making and more accurate forecasting.
Data Privacy and Collaboration
Filtering makes it easier to share only relevant data subsets, protecting sensitive information. Teams can create filtered views for specific stakeholders, ensuring compliance with privacy policies.
Collaborating on filtered data is more efficient in Excel 2026, thanks to improved sharing and version control features. Always review filtered ranges before sharing to prevent accidental data exposure.
Automating Weekly Reports
Using saved filter views, organizations can automate recurring reports. Here is a simple code block to illustrate the process:
' Save a custom view after applying filters
ActiveWorkbook.CustomViews.Add ViewName:="WeeklyReport", PrintSettings:=False, RowColSettings:=True
This approach saves time and ensures consistency across reporting cycles.
Summary Table: Filtering Use Cases
| Department | Filtering Purpose | Example Scenario |
|---|---|---|
| Finance | Track expenses, anomalies | Filter large transactions |
| HR | Employee segmentation | Filter by tenure or role |
| Marketing | Campaign analysis | Filter by region/channel |
| Project Management | Task tracking | Filter overdue tasks |
Filtering is a powerful skill that drives productivity and accuracy in every business function. By mastering how to filter in excel, professionals can unlock deeper insights, automate processes, and foster better collaboration.