Creating compelling dashboards in Excel has traditionally required hours of manual work, from formatting charts to writing complex formulas and ensuring data updates correctly. The emergence of artificial intelligence has fundamentally changed this landscape, making excel dashboard creation with ai not just faster but also more intelligent and accessible to users at all skill levels. Whether you're a finance manager tracking quarterly performance or a marketing analyst monitoring campaign metrics, AI-powered dashboard tools can transform your raw data into actionable visualizations in minutes rather than hours.
Understanding AI-Powered Dashboard Creation
Traditional Excel dashboards demand significant technical expertise. You need to understand pivot tables, master conditional formatting, write VLOOKUP formulas, and manually design chart layouts that communicate insights effectively. This process becomes even more challenging when dealing with multiple data sources or frequently updated information.
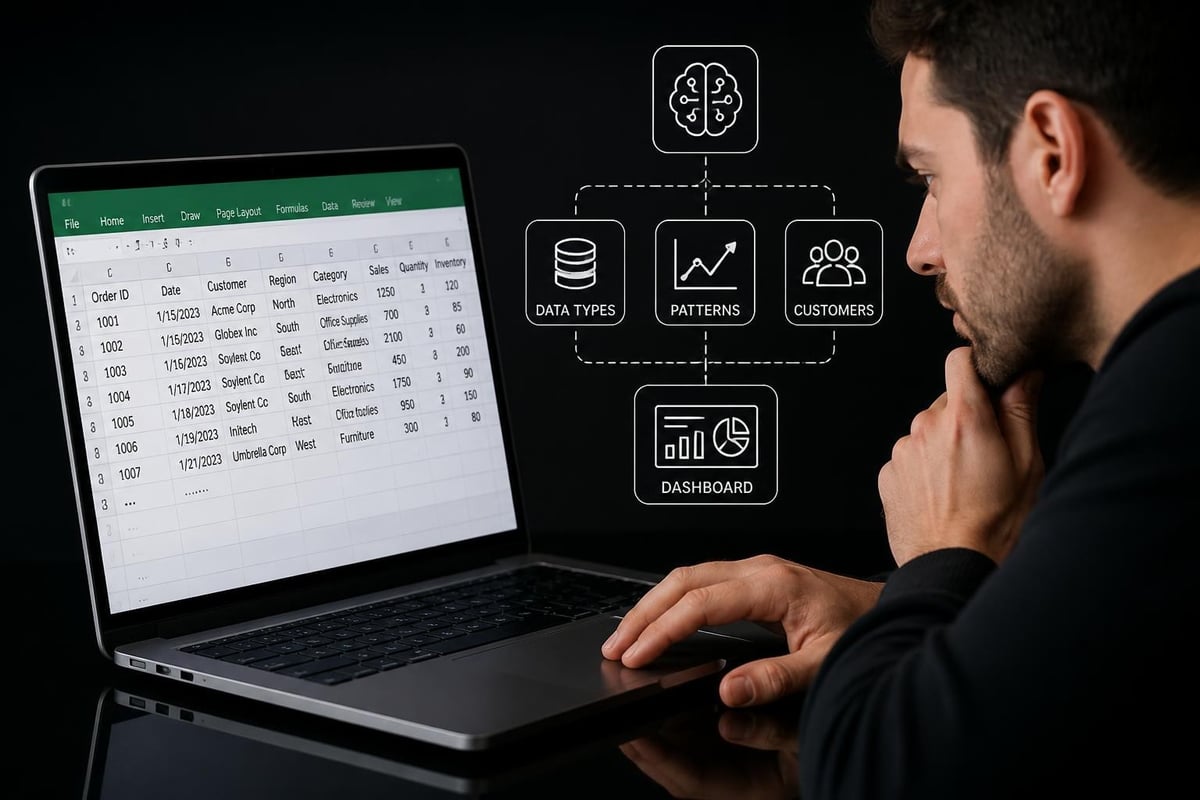
Excel dashboard creation with ai fundamentally reimagines this workflow. Instead of manually selecting chart types and configuring data ranges, AI algorithms analyze your data structure, identify key patterns, and automatically generate appropriate visualizations. These tools understand context-recognizing sales data requires different visualization approaches than inventory tracking or customer demographics.
How AI Analyzes Your Spreadsheet Data
Modern AI dashboard generators employ sophisticated algorithms to parse your Excel files. They examine column headers to understand data types, analyze numerical patterns to identify trends, and detect relationships between different data points. This intelligent analysis happens in seconds, providing recommendations that would take experienced analysts considerable time to develop manually.
The technology behind these platforms often includes:
- Pattern recognition to identify time series data, categorical information, and numerical metrics
- Natural language processing to interpret column names and data context
- Machine learning models trained on thousands of dashboard examples
- Automated chart selection based on data characteristics and best practices
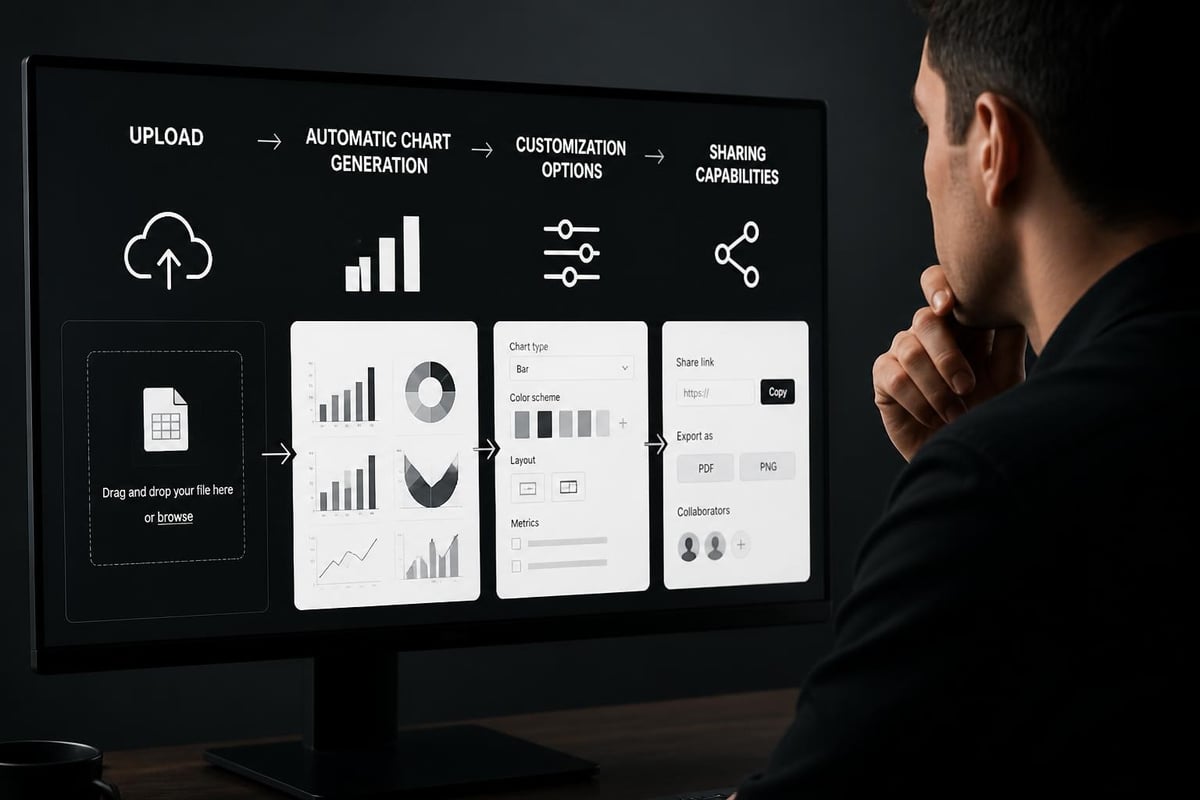
When you upload an Excel file to platforms like Bricks, which transforms spreadsheets into interactive dashboards, the AI immediately begins categorizing your information and suggesting optimal visualization strategies.
Key Benefits of AI-Driven Dashboard Tools
The advantages of using AI for Excel dashboard creation extend far beyond simple time savings. These tools democratize data visualization, making professional-quality dashboards accessible to users who may not have advanced Excel training.
Speed and Efficiency Gains
Time reduction represents the most immediate benefit. What once required 3-4 hours of manual chart creation, formatting, and formula writing now happens in minutes. Users can upload their Excel files and receive fully functional dashboards almost instantly.
This efficiency gain proves particularly valuable for recurring reports. Instead of rebuilding the same dashboard monthly or quarterly, you can simply update the underlying data and let the AI refresh all visualizations automatically.
Intelligent Chart Selection
Choosing the right chart type requires both statistical knowledge and design sensibility. Should you use a line chart or a column chart? When does a scatter plot communicate better than a bar chart? AI removes this guesswork by analyzing your data characteristics and selecting visualizations that highlight the most important insights.
| Data Type | Traditional Approach | AI-Powered Approach |
|---|---|---|
| Time Series | Manually create line charts, format axes | Auto-generates trend lines with forecasting |
| Comparisons | Build column/bar charts, adjust colors | Selects optimal comparison visual, applies best practices |
| Distributions | Create histograms, adjust bin sizes | Automatically determines bin ranges and distribution type |
| Relationships | Plot scatter charts, add trend lines | Identifies correlations and suggests appropriate visualizations |
Reduced Error Rates
Manual dashboard creation introduces numerous opportunities for errors-incorrect cell references, broken formulas, or misaligned data ranges. Excel dashboard creation with ai minimizes these risks through automated data mapping and validation. The AI maintains connections between your source data and visualizations, ensuring consistency across all dashboard elements.
Popular AI Dashboard Creation Platforms
Several platforms have emerged specifically to address the challenges of transforming Excel data into professional dashboards. Each offers unique features tailored to different user needs and technical backgrounds.
No-Code Solutions for Business Users
Platforms like ADRO’s AI dashboard builder target business professionals who need quick insights without technical complexity. These tools emphasize:
- Drag-and-drop interfaces that require no coding knowledge
- Pre-built templates for common business scenarios (sales, finance, marketing)
- Natural language queries to ask questions about your data
- Automated insight generation that highlights anomalies and trends
VizMint’s Excel-to-dashboard converter takes a similar approach, automatically detecting key metrics in your spreadsheets and recommending appropriate chart types for various business functions.
AI-Powered Analysis and Reporting
More sophisticated platforms combine dashboard creation with advanced analytics capabilities. RowSpeak’s AI agent not only builds dashboards but also analyzes your data to generate written reports, answer questions about trends, and create predictive models. This integration proves valuable when you need both visual dashboards and narrative explanations for stakeholders.
The benefit extends to users seeking comprehensive Excel data analysis capabilities beyond basic visualization-incorporating statistical analysis, forecasting, and anomaly detection into a single workflow.
Free and Accessible Options
Cost considerations matter for small businesses and individual users. ChartGen.ai’s free dashboard generator demonstrates that powerful AI tools don't always require expensive subscriptions. These platforms perform deep data analysis and automatically select optimal chart types while remaining accessible to users with limited budgets.
Building Your First AI-Powered Dashboard
Creating your initial dashboard with AI assistance follows a straightforward process, though understanding best practices ensures optimal results.
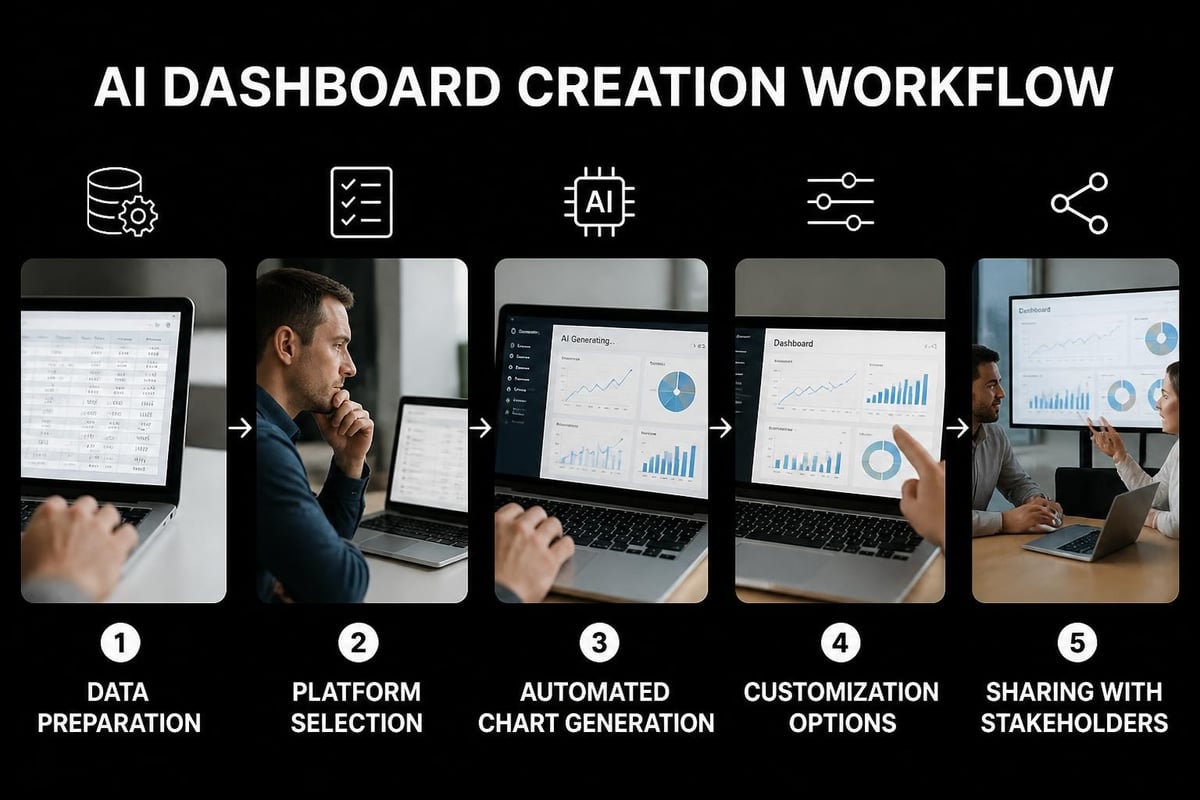
Preparing Your Excel Data
Data preparation significantly impacts dashboard quality, regardless of how sophisticated your AI tool might be. Before uploading to any platform:
- Ensure column headers clearly describe the data they contain
- Remove empty rows and columns that might confuse the AI
- Format dates consistently throughout your spreadsheet
- Verify numerical data doesn't contain text characters
- Organize related information in cohesive tables
Clean, well-structured data allows the AI to make more accurate decisions about visualization types and data relationships. This preparation aligns with fundamental spreadsheet best practices that improve both manual and automated workflows.
Selecting the Right Platform
Different AI dashboard tools excel at different tasks. Consider these factors when choosing:
- Data volume: Some platforms handle large datasets better than others
- Update frequency: Real-time dashboards require different capabilities than static reports
- Sharing requirements: Determine whether dashboards need to be interactive, embeddable, or printable
- Integration needs: Consider whether you need connections to databases, cloud storage, or other business tools
Dashboarder specializes in turning spreadsheets into interactive, shareable dashboards without requiring complex BI tools, making it ideal for teams that need collaborative features.
Customization and Refinement
While AI generates impressive initial dashboards, customization ensures the output matches your specific needs:
- Review auto-generated charts for accuracy and relevance
- Adjust color schemes to match brand guidelines or improve readability
- Add or remove visualizations based on stakeholder requirements
- Configure filters and interactivity for dynamic data exploration
- Set up automatic refresh schedules if working with regularly updated data
Most platforms balance automation with customization options, allowing users to benefit from AI efficiency while maintaining creative control over final outputs.
Advanced AI Dashboard Capabilities
Beyond basic chart generation, cutting-edge excel dashboard creation with ai incorporates sophisticated analytical features that provide deeper insights.
Predictive Analytics and Forecasting
Modern AI dashboard tools don't just visualize historical data-they project future trends. Machine learning algorithms analyze patterns in your Excel data to generate forecasts, confidence intervals, and scenario planning capabilities. This proves invaluable for sales projections, inventory planning, and financial modeling.
These predictive features extend the value of traditional Excel capabilities, complementing techniques covered in guides about automating spreadsheet workflows.
Anomaly Detection and Alerts
AI algorithms excel at identifying unusual patterns that human analysts might overlook. When reviewing sales data, for instance, the AI might flag unexpected spikes or drops, seasonal variations, or emerging trends that deserve attention. Some platforms automatically generate alerts when key metrics exceed predefined thresholds.
Anomaly AI specifically focuses on this capability, converting Excel spreadsheets into live dashboards while ensuring every metric remains traceable to original data sources for validation.
Natural Language Insights
The most advanced platforms generate written narratives explaining dashboard insights. Instead of simply showing a chart, the AI describes what the data reveals: "Sales increased 23% in Q2 compared to Q1, driven primarily by growth in the Northeast region." This narrative layer helps stakeholders who prefer written summaries alongside visual representations.
Academic Research and Future Developments
The field of AI-powered dashboard creation continues evolving rapidly, with academic research pushing boundaries beyond current commercial offerings.
Declarative Dashboard Specifications
Research into declarative specifications for authoring metrics dashboards aims to streamline the creation process by focusing on data combinations rather than visual formatting. This approach allows users to describe what they want to measure, letting the AI handle all implementation details.
Deep Reinforcement Learning Applications
Studies on systems like DashBot, which uses deep reinforcement learning to generate insight-driven dashboards, demonstrate how AI can reduce manual effort while producing more thoughtful visualizations. These systems learn from user interactions, continuously improving their recommendations based on which dashboards prove most valuable.
These research developments suggest that excel dashboard creation with ai will become increasingly sophisticated, eventually anticipating user needs before explicit requests.
Integration with Excel Workflows
AI dashboard tools work most effectively when integrated into broader Excel workflows rather than replacing them entirely. Understanding this relationship helps maximize productivity.
Complementing Native Excel Features
Excel's built-in features remain valuable for detailed analysis and data manipulation. AI dashboards excel at high-level visualization and insight generation, while Excel provides the granular control needed for complex calculations and data transformation. Many professionals use both in tandem:
- Excel for data cleaning, formula creation, and detailed analysis
- AI dashboards for executive summaries and stakeholder presentations
- Excel pivot tables for ad-hoc exploration
- AI platforms for automated regular reporting
This hybrid approach leverages the strengths of each tool while compensating for their respective limitations.
Data Connectivity and Updates
Modern AI dashboard platforms maintain connections to your source Excel files, automatically updating visualizations when underlying data changes. This dynamic relationship proves crucial for dashboards that track ongoing metrics like:
- Daily sales performance
- Website traffic statistics
- Inventory levels
- Project completion percentages
- Financial account balances
Users familiar with creating effective pivot tables will recognize similar benefits in AI dashboards-both respond dynamically to data changes without requiring complete reconstruction.
Choosing Between AI Tools and Traditional Methods
Not every dashboard scenario requires AI assistance. Understanding when to use excel dashboard creation with ai versus traditional Excel methods ensures you select the most efficient approach.
When AI Tools Excel
AI-powered platforms deliver maximum value in these situations:
- Time-sensitive deliverables requiring rapid dashboard creation
- Non-technical users who lack advanced Excel skills
- Large datasets where manual chart creation becomes tedious
- Recurring reports that benefit from automation
- Exploratory analysis where you're unsure which visualizations will prove most valuable
When Traditional Excel Works Better
Manual Excel dashboard creation remains preferable for:
- Highly customized layouts with specific design requirements
- Complex formulas requiring intricate calculations
- Unique visualizations not available in AI platform libraries
- Sensitive data that cannot be uploaded to external platforms
- Legacy systems where maintaining existing Excel-based processes matters
Many experienced users combine both approaches, using AI for initial dashboard creation then refining outputs in Excel for final polish.
Best Practices for Sustainable Dashboard Management
Creating dashboards represents just the beginning-maintaining their relevance and accuracy over time requires thoughtful practices.
Documentation and Version Control
Even with AI assistance, documenting your dashboard logic ensures long-term maintainability:
- Record data source locations and update schedules
- Note customization decisions made after initial AI generation
- Track version changes when dashboard requirements evolve
- Document user access permissions for shared dashboards
- Maintain backup copies of both source data and dashboard configurations
This documentation proves invaluable when troubleshooting issues or training new team members.
Performance Optimization
As data volumes grow, dashboard performance can degrade. Optimization strategies include:
| Challenge | Solution |
|---|---|
| Slow loading times | Aggregate data before visualization, limit date ranges |
| Outdated information | Schedule automatic refresh cycles, implement data validation |
| Cluttered displays | Focus on key metrics, use progressive disclosure for details |
| Mobile accessibility issues | Test dashboards on various devices, prioritize responsive design |
Stakeholder Feedback Integration
The most effective dashboards evolve based on user needs. Regularly solicit feedback about:
- Which metrics provide the most value
- What additional insights would help decision-making
- Whether current visualizations communicate clearly
- How dashboard interactivity could improve
This iterative refinement ensures your AI-generated dashboards remain aligned with business objectives rather than becoming static artifacts.
Security and Data Privacy Considerations
When using cloud-based AI dashboard tools, understanding security implications protects sensitive business information.
Data Upload Policies
Before uploading Excel files to any AI platform, verify:
- Data encryption standards during transmission and storage
- Geographic location of servers hosting your information
- Compliance certifications relevant to your industry (HIPAA, SOC 2, GDPR)
- Data retention policies and deletion procedures
- Access control mechanisms for shared dashboards
Some organizations require password protection for Excel workbooks before external sharing, adding an extra security layer.
Alternative Deployment Options
For highly sensitive data, consider:
- On-premise AI solutions that don't require cloud uploads
- Private cloud deployments within your organization's infrastructure
- Hybrid approaches using AI for non-sensitive data and traditional Excel for confidential information
- Data anonymization before uploading to external platforms
Balancing convenience with security ensures you benefit from AI capabilities without compromising data integrity.
Measuring Dashboard ROI and Impact
Implementing excel dashboard creation with ai represents an investment of time and potentially money. Tracking return on investment validates these decisions and identifies improvement opportunities.
Time Savings Quantification
Calculate hours saved by comparing:
- Traditional dashboard creation time (averaged across multiple projects)
- AI-powered creation time (including data preparation and customization)
- Update and maintenance time for both approaches
- Training time required for team members to use each method
Most organizations report 60-80% time reduction when transitioning from manual to AI-assisted dashboard creation.
Decision Quality Improvements
Beyond efficiency, assess whether AI dashboards improve business outcomes:
- Faster identification of problems and opportunities
- Increased frequency of data-driven decisions
- Broader access to insights across organizational levels
- More accurate forecasting through AI-powered predictive features
These qualitative improvements often exceed the value of simple time savings.
Training Your Team on AI Dashboard Tools
Successfully adopting excel dashboard creation with ai requires organizational change management, not just technology implementation.
Structured Learning Approaches
Effective training programs combine:
- Hands-on workshops where team members create dashboards with their own data
- Video tutorials for self-paced learning and future reference
- Documentation libraries covering common scenarios and troubleshooting
- Peer mentoring pairing experienced users with beginners
- Regular skill assessments to identify knowledge gaps
Organizations offering Excel training services can extend their curriculum to include AI dashboard tools, providing comprehensive data visualization education.
Overcoming Resistance to Change
Some team members may resist AI tools, preferring familiar Excel methods. Address concerns through:
- Demonstrating quick wins with simple but impactful dashboards
- Emphasizing augmentation rather than replacement of Excel skills
- Providing ample practice time before requiring AI tool usage
- Celebrating successes when team members create effective dashboards
- Maintaining flexibility to use traditional methods when appropriate
This change management approach ensures smooth adoption and sustained engagement with new tools.
AI has fundamentally transformed how we approach excel dashboard creation, making professional visualizations accessible to users at all skill levels while dramatically reducing creation time. Whether you choose specialized platforms or integrate AI capabilities into existing Excel workflows, these tools empower faster, smarter decision-making through automated data visualization. If you're struggling with complex spreadsheets, need training on modern dashboard techniques, or want to optimize your data visualization workflows, The Analytics Doctor provides personalized Excel help and training that makes your data work harder for you.