Struggling to figure out how to put data analysis on Excel for meaningful insights? You are not alone. Every year, millions face the same challenge of making sense of raw data using Excel’s powerful features.
This guide is your step-by-step roadmap to mastering data analysis in Excel, no matter your experience level. Learn how to transform complex information into clear, confident decisions.
We will cover everything you need: preparing your data, enabling the right tools, performing core and advanced analyses, troubleshooting, and adopting best practices for 2026. By the end, you will have the skills to unlock Excel’s full potential and drive real results.
Preparing Your Data for Analysis in Excel
Before diving into how to put data analysis on excel, it is crucial to properly prepare your data. Clean, well-structured data forms the foundation for accurate and insightful analysis. In this section, you will learn the essential steps to get your data ready, from understanding data types to ensuring data quality.
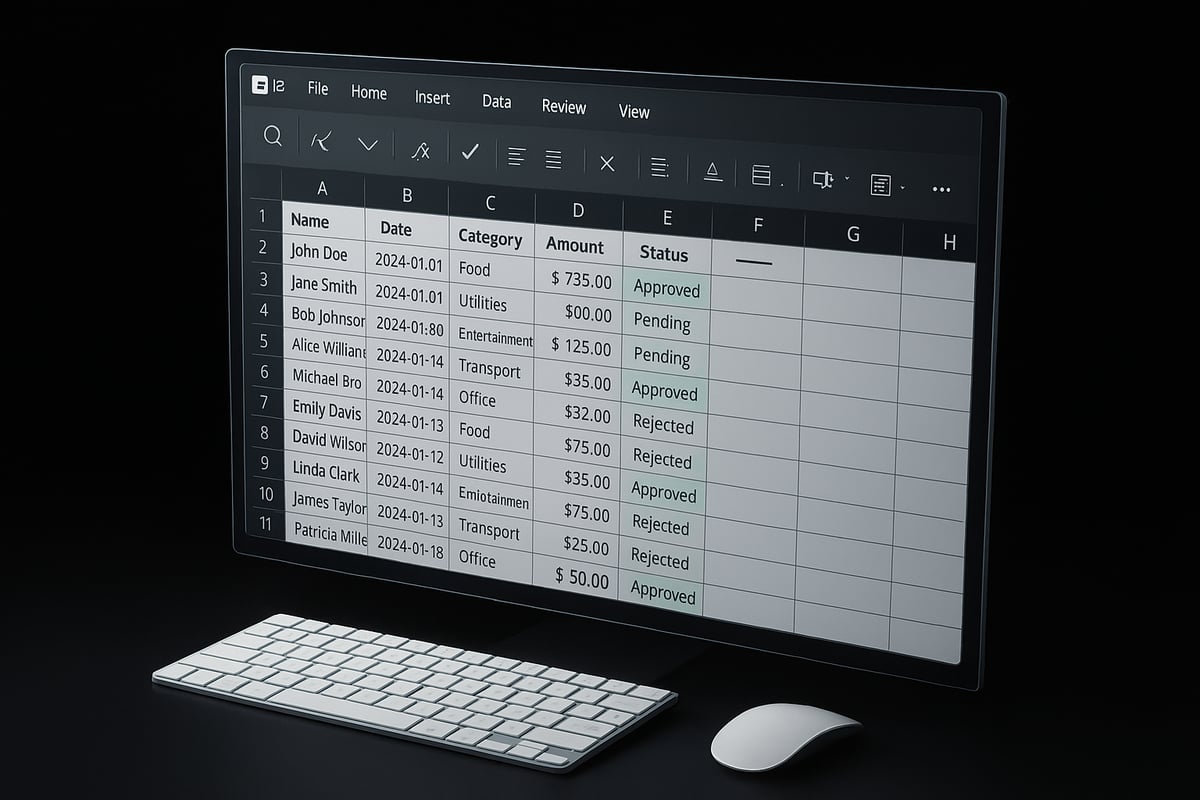
Understanding Data Types and Formats
Consistent data types are the backbone of any reliable analysis in Excel. Numbers, text, and dates must be uniformly formatted to avoid calculation errors or misleading results. For example, treating a date as text can prevent sorting or time-based analysis. A common pitfall when learning how to put data analysis on excel is mixing data types within a single column, causing formulas to fail or produce inaccurate outputs.
To check and convert data types, use Excel’s formatting options or built-in functions like VALUE() or DATEVALUE(). Data Validation is another critical tool for preventing entry errors and enforcing consistency. For a comprehensive approach, review Data validation rules in Excel to set up robust controls. Industry statistics reveal that over 60% of spreadsheet errors stem from incorrect data formatting, highlighting the importance of this step.
Cleaning and Organizing Data
After ensuring correct data types, focus on cleaning and organizing your dataset. Start by removing duplicates using Excel’s Remove Duplicates feature. Address blank cells and missing values with tools like IFERROR and filters. Standardizing entries with TRIM, UPPER, LOWER, and Find & Replace ensures consistency, especially for names or categories.
Splitting and combining columns using Text to Columns or CONCAT can simplify complex data. When you are figuring out how to put data analysis on excel for quarterly reports, cleaning steps like these prevent misleading results. For instance, cleaning sales data ensures that no duplicate transactions skew revenue figures.
- Remove duplicates
- Handle blanks and errors
- Standardize formats
Effective organization saves time and reduces errors during analysis.
Structuring Data Tables for Analysis
Properly structured data tables enhance Excel’s analytical capabilities. Converting raw data into Excel Tables unlocks benefits such as structured references and automatic range expansion. Consistent naming conventions for tables and columns improve clarity and make formulas easier to audit.
With Excel 2026, Power Query offers improved tools for creating relationships between tables, allowing seamless consolidation of customer transactions or other datasets. When learning how to put data analysis on excel, structuring tables is essential for advanced features like PivotTables or data models.
Example: Organize customer transaction records into a table with clear headers, enabling quick pivot analysis or trend identification.
Importing Data from External Sources
Modern data analysis often involves importing information from various formats. Excel 2026 supports CSV, TXT, XML, and JSON files, making it easy to bring in data from different systems. Use Get & Transform (Power Query) to import and clean data in one workflow.
Connecting to cloud sources like SharePoint, OneDrive, or Google Sheets provides real-time access to collaborative data. When considering how to put data analysis on excel for trend analysis, importing survey results or external data sets is a common starting point.
Example: Import a CSV file containing survey feedback, then use Power Query to filter and clean responses before analysis.
Ensuring Data Quality and Integrity
Maintaining data quality is vital for trustworthy analysis. Use Conditional Formatting to audit your data visually, highlighting outliers or inconsistencies. Remove Duplicates and Data Validation tools help maintain accuracy throughout your workbook.
Documenting data sources and changes ensures transparency and accountability, especially when collaborating. According to Gartner, 40% of business initiatives fail due to poor data quality, underscoring the importance of this step when mastering how to put data analysis on excel.
By prioritizing data quality, you lay the groundwork for confident decisions and reliable results.
Enabling and Accessing Excel’s Data Analysis Tools
Unlocking the full power of Excel for data analysis starts with accessing the right tools. Whether you are new or experienced, knowing how to put data analysis on excel means activating essential features and customizing your workspace for efficiency. Let us walk through the steps to ensure you are set up for success.
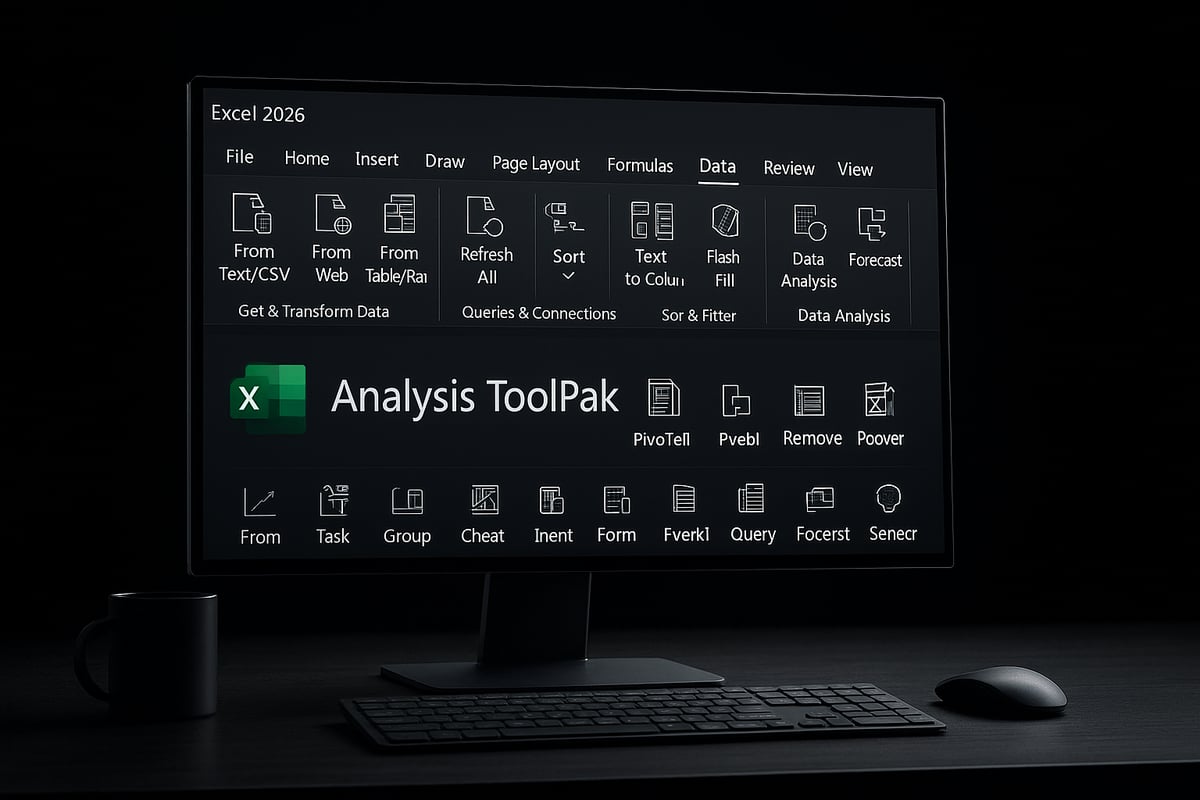
Activating the Analysis ToolPak
The Analysis ToolPak is a powerful add-in that expands how to put data analysis on excel by adding advanced statistical tools. To enable it in Excel 2026, go to File, select Options, then Add-ins. In the Manage box, choose Excel Add-ins and click Go. Check Analysis ToolPak, and hit OK. If you do not see it, make sure your Office installation is up to date and you have the correct permissions.
If you plan to run regression analysis or complex statistics, activating this add-in is a must. Should issues arise, restart Excel or reinstall the add-in from Microsoft’s official site for troubleshooting.
Overview of Built-in Data Analysis Features
Excel 2026 offers a robust suite of analysis features that make how to put data analysis on excel straightforward for any user. Core tools include PivotTables, interactive charts, Solver for optimization, and the enhanced Analysis ToolPak. New in 2026 are AI-powered insights and improved charting capabilities for deeper, automated analysis.
When deciding which feature to use, think about your analysis goals. For summarizing large datasets, Creating Excel Pivot Tables is an excellent place to start. Charts are ideal for visualization, while Solver handles complex computations. Compared to older versions, Excel 2026 streamlines workflows and adds intelligent recommendations.
Navigating the Data Tab and Toolbars
The Data tab in Excel 2026 centralizes all major analysis tools, making how to put data analysis on excel more efficient. You will find options for importing data, launching PivotTables, and accessing Power Query in one place.
Customize your ribbon for faster access: right-click on the ribbon, select Customize the Ribbon, and add your most-used commands. Setting up keyboard shortcuts for frequent tasks saves time and keeps your workflow smooth. For example, pinning the Quick Analysis tool can speed up repetitive analysis steps.
Setting Up for Advanced Users: Power Query and Power Pivot
For advanced users looking to elevate how to put data analysis on excel, Power Query and Power Pivot are essential. Power Query excels at cleaning and transforming imported data, while Power Pivot is designed for building data models and complex calculations.
Enable these add-ins by navigating to Options, then Add-ins, and manage permissions as needed. Use Power Query when you need to combine multiple sources or automate data preparation. Power Pivot is best for creating relationships between tables and running advanced DAX formulas. For instance, combining sales and inventory data for comprehensive analysis becomes seamless with these tools.
Step-by-Step: How to Put Data Analysis on Excel
Unlocking the full power of Excel starts with a clear, structured workflow. By following these seven essential steps, you can master how to put data analysis on Excel and turn raw information into actionable insights. Whether you are new to spreadsheets or a seasoned analyst, this guide provides practical instructions for every stage of the process.
Step 1: Import or Enter Your Data
The journey of how to put data analysis on Excel begins with gathering your data. You can either manually type data into cells or import it from various sources. Manual entry is quick for small datasets, but importing is more efficient for larger or recurring data.
To import, click Data > Get Data and select your file type, such as CSV, TXT, or Excel. The import wizard guides you through mapping columns and previewing data before finalizing. Excel 2026 supports even more formats and direct connections to cloud services.
Example:
Suppose you receive monthly sales data as a CSV file. Use the import wizard to bring this file into Excel, ensuring all columns are properly formatted for analysis.
Quick Tip:
- Always review imported data for consistency and completeness.
- Use the Text to Columns tool for splitting combined data.
By starting with accurate, well-structured data, you set the stage for effective analysis.
Step 2: Prepare and Clean Your Data
A critical step in how to put data analysis on Excel is cleaning your dataset. Even small errors can skew results, so focus on accuracy and consistency.
Begin by removing duplicates under Data > Remove Duplicates. Use TRIM to clear extra spaces and Find & Replace for standardizing entries. For missing values, apply =IFERROR(value, "") to handle errors gracefully. Filtering helps identify outliers or blanks.
Example:
You are preparing survey responses. Use Remove Duplicates to ensure each response is unique, then use TRIM and UPPER to standardize text fields.
Checklist for Clean Data:
- Remove duplicates and blanks
- Standardize formats (dates, text)
- Correct inconsistencies
Proper cleaning ensures your analysis will be reliable and actionable.
Step 3: Set Up Data Tables or Ranges
Setting up tables is a cornerstone of how to put data analysis on Excel. Tables enable structured referencing and dynamic ranges, making calculations easier and more accurate.
Convert your data into a table by selecting your range and pressing Ctrl + T. Name your table via the Table Design tab for clarity. Use clear, descriptive names to simplify formulas and referencing.
Benefits of Excel Tables:
- Automatic expansion when adding new data
- Structured references for formulas
- Enhanced sorting and filtering
Example:
Track monthly expenses by converting your list into a table named Expenses2026. This makes it easier to sum, filter, and analyze spending trends.
Tables keep your data organized and ready for deeper analysis.
Step 4: Choose the Right Analysis Tool
Selecting the right tool is essential for how to put data analysis on Excel. The choice depends on your analytical goals.
- PivotTables are best for summarizing and exploring data.
- Charts visualize trends and comparisons.
- Analysis ToolPak handles advanced statistical tests like regression or ANOVA.
Excel 2026 introduces AI-powered insights and enhanced chart types, making analysis more intuitive. Match your tool to your question: use PivotTables for sales trends, or the ToolPak for hypothesis testing.
Example:
To analyze sales by region, insert a PivotTable, drag "Region" to Rows, and "Sales" to Values. Instantly, you see a summary by location.
Choosing wisely saves time and delivers clearer insights.
Step 5: Apply Data Analysis Techniques
Now, apply your chosen techniques to unlock insights. This is where how to put data analysis on Excel becomes powerful.
- PivotTables: Summarize and group data efficiently.
- Charts: Create line, bar, or scatter plots to visualize findings.
- Analysis ToolPak: Run regression, t-tests, and more for statistical depth.
- Quick Analysis: Select data, click the lightning icon, and preview instant summaries.
- AI Features: Use the new "Analyze Data" tool for automated insights and anomaly detection.
Example:
Run a regression analysis to see how marketing spend influences sales. Select the data, choose Data Analysis > Regression, and interpret the output.
For advanced users, Power Pivot enables complex data modeling. For a deep dive, see this Power Pivot and Data Modeling guide.
With these tools, you can turn raw data into actionable strategies.
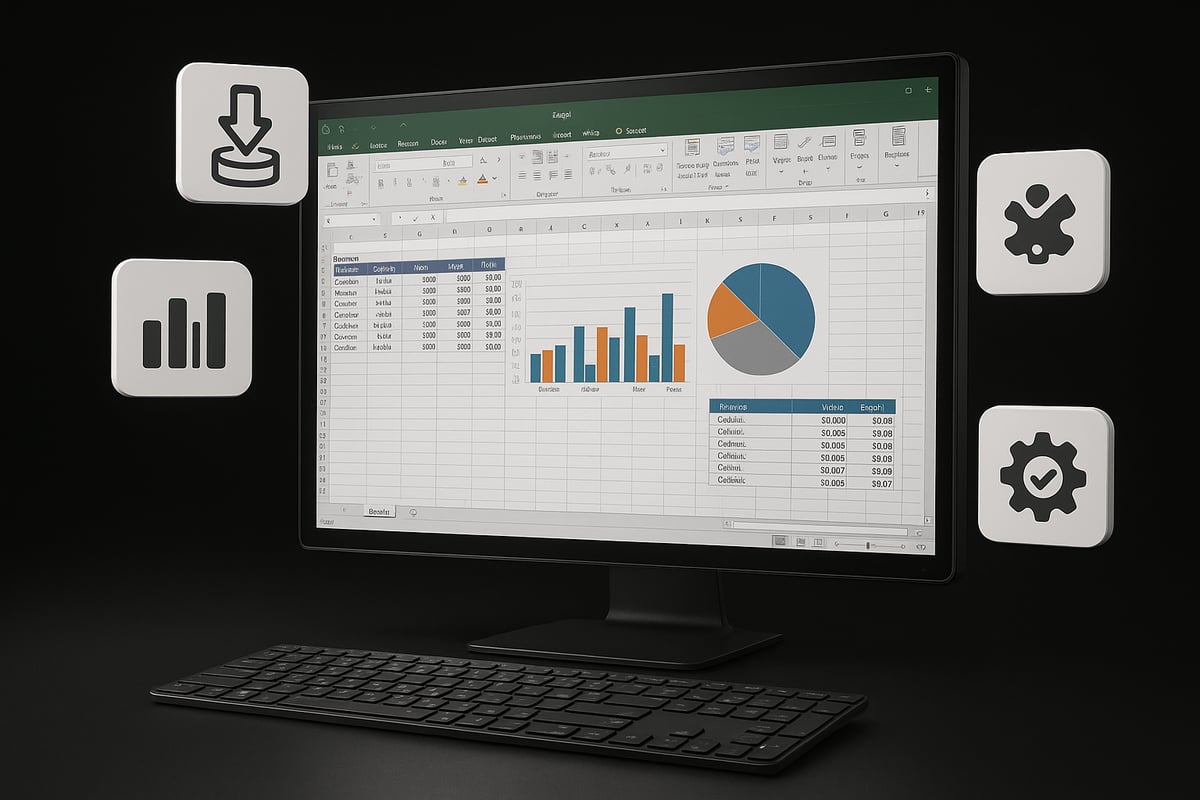
Step 6: Interpret and Visualize Results
Interpreting your results is a vital part of how to put data analysis on Excel. Look for trends, patterns, and key metrics in your PivotTables and charts.
Use Conditional Formatting to highlight outliers or targets. Create dashboards with Slicers and Timelines for interactive filtering. Visual elements help stakeholders quickly grasp insights.
Example:
Build a sales dashboard with a PivotChart, slicers for product categories, and conditional formatting to flag top-performing regions.
Visualization transforms numbers into stories, making complex data easy to understand.
Step 7: Export, Share, and Automate Reports
The final step in how to put data analysis on Excel is sharing your findings. Export results to PDF or PowerPoint using File > Export. Share workbooks via OneDrive, Teams, or Google Workspace for collaboration.
Automate recurring reports with Macros or Power Automate in Excel 2026. Schedule tasks like weekly sales summaries or monthly financial closes to save time and reduce manual work.
Example:
Set up a macro to refresh sales data and email a summary every Monday, ensuring stakeholders always have the latest insights.
Efficient sharing and automation maximize the value of your analysis.
Advanced Data Analysis Techniques in Excel 2026
Unlocking the full power of Excel 2026 means moving beyond basic charts and formulas. If you want to master how to put data analysis on Excel, you need to explore advanced techniques designed for deeper insights, automation, and smarter decision-making. The following methods help you handle big data, complex modeling, and predictive analytics with confidence.
Using Power Query for Data Transformation
Power Query is a robust tool for transforming and merging data from multiple sources. If you are learning how to put data analysis on Excel, mastering Power Query is essential for cleaning and reshaping datasets before analysis.
With Power Query, you can:
- Import data from Excel, CSV, databases, or web sources
- Automate repetitive cleaning steps, saving you hours of manual work
- Merge and append multiple tables with a few clicks
An example: Imagine you receive monthly sales files from regional managers. With Power Query, you can combine these into a single, clean dataset in minutes. This not only streamlines your workflow but also ensures consistency for your analysis.
Leveraging Power Pivot for Complex Analysis
Power Pivot takes your analytics to a new level by allowing you to build sophisticated data models. When you want to understand how to put data analysis on Excel for multi-table scenarios, Power Pivot is indispensable.
Key features include:
- Creating relationships between different tables for unified analysis
- Writing advanced DAX formulas for custom calculations and KPIs
- Handling large datasets without slowing down your workbook
For a comprehensive overview, see this Power Pivot Overview to explore its full capabilities. Suppose you need to calculate year-over-year growth across product lines. Power Pivot lets you link sales, inventory, and customer tables, offering dynamic insights that standard formulas cannot achieve.
Applying Statistical Analysis with Analysis ToolPak
The Analysis ToolPak is Excel’s built-in suite for statistical analysis. If you are exploring how to put data analysis on Excel for scientific or business research, the ToolPak enables regression, correlation, t-tests, and more.
You can:
- Quickly run descriptive statistics on large datasets
- Perform hypothesis testing such as t-tests and ANOVA
- Interpret output tables with clear labels and summaries
For example, running a t-test on A/B testing results helps you determine if a marketing change had a significant impact. The ToolPak simplifies the process, providing ready-to-use results for reporting and decision-making.
Utilizing AI and Machine Learning Features
Excel 2026 introduces AI-driven tools for predictive analytics and anomaly detection. Knowing how to put data analysis on Excel now includes leveraging machine learning for smarter forecasting.
Excel’s AI features allow you to:
- Use “Analyze Data” to automatically uncover trends and outliers
- Generate forecasts with a single click, using historical data
- Detect anomalies in real time, flagging data points that require attention
For example, you can predict next quarter’s sales based on seasonal trends, letting AI do the heavy lifting. While these tools are powerful, always validate predictions with domain expertise for best results.
Creating Interactive Dashboards and Visualizations
Advanced dashboards bring your analysis to life. If you want to showcase how to put data analysis on Excel to stakeholders, interactive elements like Slicers, Timelines, and new chart types are key.
To build engaging dashboards:
- Use Slicers to filter data visually across multiple tables
- Integrate KPIs, charts, and tables for a holistic view
- Leverage the latest 2026 visualization tools for real-time updates
A real-world example: Retail managers can track inventory levels, sales trends, and customer feedback on a single dashboard, updating automatically as new data arrives.
Automating Data Analysis Workflows
Automation is the final step in mastering how to put data analysis on Excel. Excel 2026 enhances automation with improved Macros and integration with Power Automate.
You can:
- Record Macros to automate repetitive tasks without coding
- Write VBA scripts for custom processes and advanced logic
- Schedule data refreshes and automate report distribution to teams
Consider automating your monthly financial close. With workflows in place, Excel imports, cleans, analyzes, and shares reports automatically, freeing your time for higher-level insights.
Troubleshooting and Best Practices for Data Analysis in Excel
Mastering how to put data analysis on excel is not just about knowing the tools, but also about avoiding common pitfalls and following best practices. This section will guide you through troubleshooting frequent issues, optimizing performance, ensuring data security, and staying ahead with the latest Excel 2026 updates.
Common Data Analysis Errors and How to Fix Them
When learning how to put data analysis on excel, errors can derail your insights. Typical mistakes include formula errors like #VALUE!, #REF!, and #DIV/0!, which often stem from mismatched data types or broken cell references.
To troubleshoot:
- Double-check cell references and ranges.
- Use the Formula Auditing tools under the Formulas tab.
- Apply Data Validation to ensure input consistency.
- Test formulas with sample data before finalizing.
Over 60% of spreadsheet issues arise from formatting and logic problems. For step-by-step strategies to prevent and fix these errors, see Reducing spreadsheet errors in Excel. Addressing errors early ensures your data analysis delivers reliable results.
Performance Optimization for Large Datasets
Handling big data is a core part of how to put data analysis on excel, especially with Excel 2026’s increased capacity. Performance issues can slow down calculations and even crash workbooks if not managed well.
Key optimization tips:
| Strategy | Benefit |
|---|---|
| Use Power Query | Faster data processing |
| Minimize volatile formulas | Reduces recalculation time |
| Convert ranges to tables | Structured, efficient access |
| Delete unused rows/columns | Shrinks file size |
| Filter data before import | Limits unnecessary load |
Regularly save your work and use the “Optimize Performance” feature in Excel 2026 to identify bottlenecks. Efficient workflows let you analyze larger datasets with confidence.
Ensuring Data Security and Compliance
As you figure out how to put data analysis on excel, protecting sensitive information is crucial. Excel 2026 provides enhanced security tools, including password protection, encryption, and file-level access controls.
Best practices include:
- Use strong, unique passwords for workbooks.
- Encrypt files containing confidential data.
- Set permissions when sharing via OneDrive or Teams.
- Maintain audit trails to track changes.
Compliance with industry standards like GDPR and HIPAA is easier with built-in templates and alerts. Always review your organization’s policies before distributing reports to keep your data safe.
Staying Updated: Excel 2026 Tips and Resources
Excel evolves quickly, and staying current is vital for mastering how to put data analysis on excel. New features in Excel 2026, such as AI-driven insights and improved charting, can boost your productivity and analytical depth.
Stay informed by:
- Exploring official Microsoft Excel blogs and tutorials.
- Joining online forums and communities.
- Reviewing independent guides, such as the Top Business Analytics Tools 2026 for an overview of the latest analytics solutions.
Continuous learning ensures you leverage every advantage Excel 2026 offers for advanced data analysis.
Expert Excel Help: The Analytics Doctor
Are you still asking how to put data analysis on excel to work for you, but running into roadblocks? Even with powerful tools and guides, some Excel challenges require specialized expertise. Whether you are stuck with broken formulas, need to optimize a massive dataset, or want to implement the latest features, expert support can be the difference between frustration and clarity.

At The Analytics Doctor, our team helps users at every level unlock Excel’s full potential. Our experts not only fix common issues but also guide you through advanced analytics, automation, and AI-enhanced workflows. For those exploring the latest Claude AI Assistant for Excel, we offer hands-on support to integrate cutting-edge AI with your data analysis.
What We Offer
- Personalized Excel Training: Master how to put data analysis on excel for your unique business needs.
- Spreadsheet Troubleshooting: Fast diagnosis and repair of complex formula or data issues.
- Automation Solutions: Streamline repetitive tasks and reporting with macros, Power Automate, and more.
- Advanced Analytics: Implement best practices in forecasting, dashboards, and data modeling.
Real-World Impact
| Challenge | Solution Provided | Result |
|---|---|---|
| Quarterly reports delayed | Automated data refresh | Saved 8 hours/week |
| Formula errors in sales | Custom troubleshooting | 99% error reduction |
| Data scattered in silos | Consolidated with Power Query | Unified analytics, faster insights |
One client, a mid-sized retailer, struggled for months with inaccurate sales dashboards and manual reporting. After working with The Analytics Doctor, they learned how to put data analysis on excel to automate workflows, eliminate errors, and make faster decisions.
Getting Started is Easy
Contact us for a free consultation or explore our extensive library of Excel guides and templates. Our Texas-based team delivers tailored training and ongoing support, so you never have to face Excel challenges alone.
Ready to transform your spreadsheets? Visit The Analytics Doctor today and discover how to put data analysis on excel to drive real results.