Understanding the relationships within your data is crucial for business success, research breakthroughs, and smarter decision-making in 2026. Excel continues to be a top choice for professionals looking to analyze data, especially when it comes to discovering trends using correlation coefficients.
By mastering how to get correlation coefficient in excel, you unlock the ability to generate faster insights, improve forecasting accuracy, and drive more informed decisions. This expert guide will take you step by step through the process, making it accessible for users at any skill level.
You will learn what correlation coefficients are, why they matter, the best methods for calculation in Excel, how to interpret your results, troubleshoot common issues, and apply advanced tips for optimal analysis.
Understanding Correlation Coefficient: Concepts and Applications
Understanding the correlation coefficient is essential for anyone interested in data-driven decision-making. Whether you are in business, research, or analytics, knowing how to get correlation coefficient in excel empowers you to uncover relationships that can drive results.
The correlation coefficient is a statistical measure that describes the strength and direction of a relationship between two variables. In Excel, the most common types are Pearson, Spearman, and Kendall coefficients. Each serves a unique purpose, depending on the nature of your data.
Types of Correlation Coefficients
| Type | Measures | Data Requirements | Excel Function |
|---|---|---|---|
| Pearson | Linear relationships | Continuous, normally distributed | =CORREL() |
| Spearman | Monotonic relationships | Ordinal, non-parametric | Not built-in, use rank formulas |
| Kendall | Ordinal association | Small datasets, non-parametric | Not built-in, use custom VBA |
Pearson is ideal for linear, continuous data, while Spearman and Kendall are suitable when data are ranked or not normally distributed. To deepen your understanding of these types and their significance, consider this Correlation Coefficient in Data Analysis guide.
Correlation analysis is fundamental in business intelligence. It helps analysts identify connections, such as how advertising spend may relate to sales revenue, or how weather patterns could impact product demand. For example, a retail company might use how to get correlation coefficient in excel to reveal that higher marketing investment often leads to increased sales, supporting better budget allocation.
Real-world applications are vast:
- Sales forecasting: Understanding how various factors like promotions or seasonality impact sales.
- Financial analysis: Evaluating the relationship between market indices or asset returns.
- Scientific research: Analyzing links between experimental variables.
A 2024 Microsoft survey found that over 70% of analysts regularly use correlation analysis in Excel for business reporting. This highlights how to get correlation coefficient in excel as a core skill in everyday analytics.
However, there are common misconceptions. A strong correlation does not imply causation. For instance, ice cream sales and sunglasses sold may rise together in summer, but one does not cause the other. Recognizing this distinction is crucial when interpreting results.
There are also limitations. Correlation coefficients can be skewed by outliers or non-linear data. Excel’s tools are most appropriate when your data is well-structured, variables are paired, and the goal is to explore potential relationships rather than prove cause and effect.
Scenarios where Excel’s correlation features shine include:
- Quick exploratory analysis of sales trends
- Financial portfolio risk assessment
- Academic projects comparing variable relationships
Mastering how to get correlation coefficient in excel allows you to move beyond gut feelings and make informed, data-backed decisions. With the right approach, Excel becomes a powerful ally for anyone seeking clarity from complex datasets.
Preparing Your Data for Correlation Analysis in Excel
Accurate results in how to get correlation coefficient in excel start with well-prepared data. Before running any correlation calculations, you must ensure your dataset is clean, consistent, and ready for analysis. Neglecting data preparation can lead to misleading insights, wasted time, and poor decision-making.
Step 1: Remove Duplicates
Duplicate records can distort your correlation results. Always scan your data for repeated entries before you begin. In Excel, use the Remove Duplicates feature to quickly clean your dataset. This tool allows you to select columns for duplicate checks, ensuring only unique records remain.
If you need a detailed walkthrough, see this How to remove duplicate records in Excel guide. Removing duplicates is a critical first step in how to get correlation coefficient in excel, as it prevents inflated or misleading relationships.
Step 2: Handle Missing Values and Standardize Formatting
Missing values can cause errors or skew your correlation analysis. Start by scanning your dataset for blank cells, N/A values, or inconsistent entries. Decide whether to remove rows with missing data or impute values based on context.
Consistent formatting is essential for Excel functions to work properly. Standardize number formats, dates, and text entries. For instance, ensure all dates follow the same format (e.g., YYYY/MM/DD), and numbers use the correct decimal separator. Proper formatting supports smooth calculation when you move on to how to get correlation coefficient in excel.
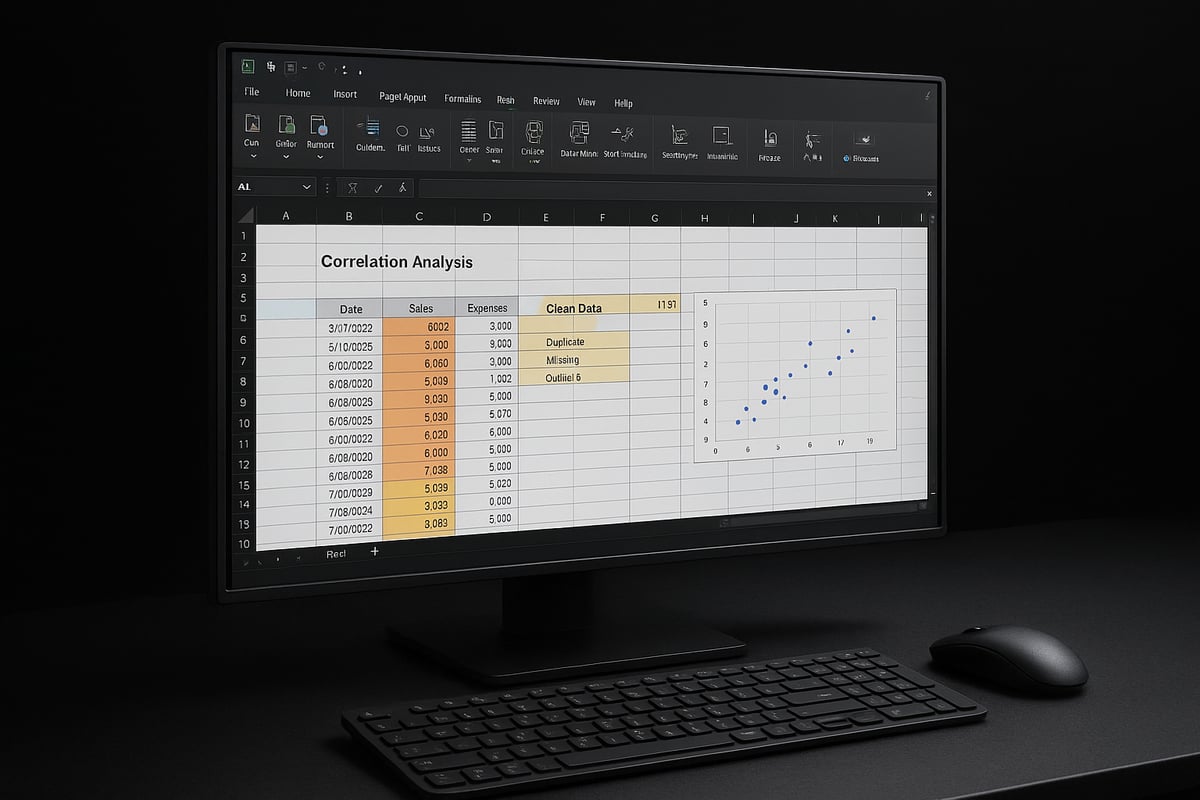
Step 3: Identify and Address Outliers
Outliers are extreme values that can distort correlation results. Use Excel’s built-in tools, such as Conditional Formatting or scatterplots, to visualize and spot potential outliers. A single outlier can drastically change the correlation coefficient, so review any anomalies carefully.
If you find outliers, decide whether they are valid data points or errors. In some cases, you may need to remove or adjust these values to maintain the integrity of your analysis. Addressing outliers is an integral part of preparing for how to get correlation coefficient in excel.
Step 4: Normalize and Organize Data
Normalization scales your data to a common range, which can be important when variables have different units or magnitudes. For example, sales in dollars and website visits in counts may need normalization before analysis.
Label columns clearly and organize your data in a tabular format. Each variable should have a descriptive header, and data should be arranged in rows without gaps. Proper organization makes it easier to select ranges for correlation and minimizes mistakes.
Step 5: Validate Data Integrity
Before you calculate how to get correlation coefficient in excel, use data validation tools to catch errors. Excel’s Data Validation feature helps enforce rules, such as restricting entries to numbers or specific date ranges. This prevents accidental input mistakes that could affect your correlation results.
Regularly audit your dataset to confirm that all values meet the required criteria. Well-validated data supports trustworthy and reproducible analysis.
Best Practices for Data Preparation
- Always back up your original dataset before making changes.
- Document every data cleaning step for transparency.
- Use Excel’s filtering and sorting tools to review data quickly.
- Double-check for hidden rows or columns that could affect analysis.
- Consider using templates to standardize your process.
By following these steps, you lay a strong foundation for how to get correlation coefficient in excel. Clean, organized, and validated data ensures your correlation analysis is accurate and reliable.
Step-by-Step Guide: Calculating Correlation Coefficient in Excel
Unlocking the power of correlation analysis starts with knowing exactly how to get correlation coefficient in Excel, regardless of your experience level. This guide covers three expert-approved methods, each designed to help you extract insights from your data quickly and accurately. You will learn how to use built-in functions, leverage advanced add-ins, and analyze multiple variables with confidence.
Method 1: Using the CORREL Function
The simplest way to learn how to get correlation coefficient in Excel is by using the built-in CORREL function. This approach is ideal for comparing two variables and provides immediate results.
Steps:
- Organize your data in two adjacent columns (e.g., A and B).
- Click an empty cell where you want the result.
- Enter the formula:
=CORREL(A2:A101, B2:B101) - Press Enter. The cell displays the correlation coefficient.
Syntax:=CORREL(array1, array2)
array1andarray2are the data ranges for your variables.- The result ranges from -1 (perfect negative) to +1 (perfect positive correlation).
For a detailed walkthrough and more examples, see Calculating Correlation in Excel.
Example:
Suppose column A lists monthly advertising spend and column B lists sales revenue. Applying the CORREL function reveals the strength of their relationship.
Tip:
Use Ctrl + Shift + Enter for array formulas if using older Excel versions.
Method 2: Using the Analysis ToolPak
For users seeking a more automated solution on how to get correlation coefficient in Excel, the Analysis ToolPak is a powerful add-in. It simplifies correlation calculations, especially with larger datasets.
Activating the ToolPak:
- Go to "File" > "Options" > "Add-ins."
- In "Manage," select "Excel Add-ins" and click "Go."
- Check "Analysis ToolPak" and click "OK."
Calculating Correlation:
- Click "Data" tab, then "Data Analysis."
- Select "Correlation" and click "OK."
- Specify your data range (e.g., A1:C101 for multiple variables).
- Choose output location and click "OK."
Excel generates a correlation table, showing coefficients for each pair of variables. This method is efficient when comparing several variables at once.
Excel 2026 Update:
The new interface offers streamlined navigation and improved output formatting, making it easier to interpret results.
Troubleshooting:
If the ToolPak is missing, ensure Excel is updated or reinstall the add-in.
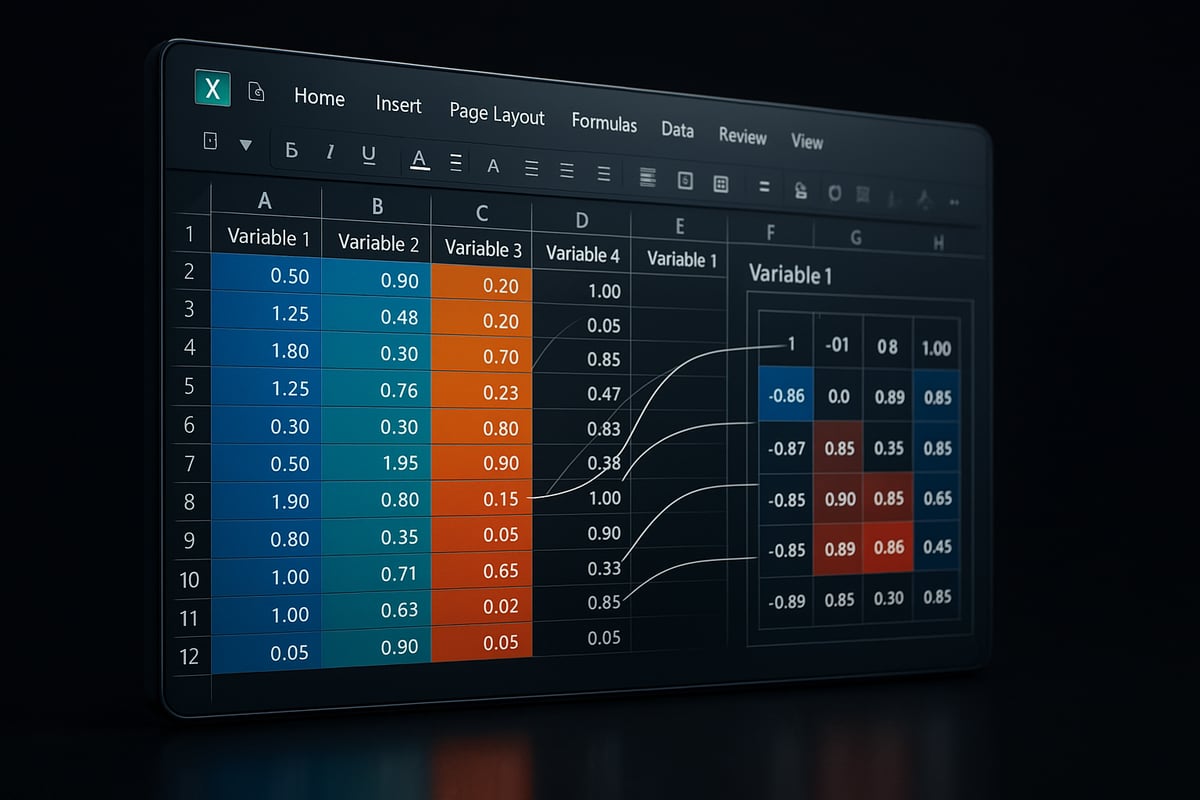
Method 3: Creating a Correlation Matrix
When analyzing multiple variables, knowing how to get correlation coefficient in Excel for all pairs is crucial. A correlation matrix provides a comprehensive view.
Steps:
- Prepare your dataset with variables in columns (e.g., A, B, C, D).
- Use the Analysis ToolPak's "Correlation" feature as above.
- Select the entire data range.
- The output is a matrix, where each cell shows the correlation between two variables.
Manual Matrix Using CORREL:
- In a blank table, use
=CORREL($A$2:$A$101, $B$2:$B$101)and drag across cells to fill all combinations.
Table Example:
| A | B | C | |
|---|---|---|---|
| A | 1 | 0.82 | 0.45 |
| B | 0.82 | 1 | 0.30 |
| C | 0.45 | 0.30 | 1 |
Tip:
A matrix helps spot strong and weak relationships at a glance, supporting better decision-making.
Tips, Troubleshooting, and Performance
Mastering how to get correlation coefficient in Excel also means knowing how to avoid errors and speed up your workflow.
Common Errors:
#DIV/0!: Occurs if one variable has no variation.#VALUE!: Caused by non-numeric data or mismatched range sizes.
Troubleshooting Steps:
- Check for blank cells, text entries, or inconsistent ranges.
- Use Excel's "Go To Special" to quickly locate errors.
Manual vs. Automated Comparison:
| Approach | Best For | Pros | Cons |
|---|---|---|---|
| Manual | Small datasets | Flexible, transparent | Time-consuming |
| ToolPak | Medium/large datasets | Fast, handles multiple vars | Less customizable |
Excel 2026 Enhancements:
- Faster calculation speeds, even with large data.
- Improved error messages for easier debugging.
By following these approaches, you can confidently answer how to get correlation coefficient in Excel for any dataset, ensuring your analysis is both robust and efficient.
Advanced Correlation Analysis Techniques in Excel
Unlocking the full potential of correlation analysis in Excel requires moving beyond the basics. As data complexity increases, so does the need for sophisticated techniques that deliver deeper insights. Mastering advanced methods not only refines your understanding of how to get correlation coefficient in excel, but also empowers you to handle real-world business challenges with precision.

Partial Correlation in Excel
Partial correlation assesses the relationship between two variables while controlling for the effect of one or more additional variables. This is essential when you want to isolate the direct association between metrics, eliminating confounding influences.
While Excel does not have a built-in function for partial correlation, you can calculate it using a series of formulas based on the correlation matrix. For example, to find the partial correlation between X and Y controlling for Z, use the formula:
=(CORREL(X,Y)-CORREL(X,Z)*CORREL(Y,Z))/(SQRT(1-CORREL(X,Z)^2)*SQRT(1-CORREL(Y,Z)^2))
Applying this approach allows you to answer more nuanced questions about your data. If you are exploring how to get correlation coefficient in excel for controlled scenarios, partial correlation is a powerful tool for advanced users.
Using Array Formulas and Dynamic Arrays
Array formulas and dynamic arrays expand your analytical reach in Excel. With dynamic arrays, you can calculate correlation coefficients across multiple variable pairs simultaneously. For example, using =CORREL(A1:A100, B1:B100) within an array formula allows you to automate calculations for entire datasets.
Dynamic arrays, introduced in recent Excel versions, simplify how to get correlation coefficient in excel for large-scale analyses. You can construct a correlation matrix for dozens of variables in a few steps, reducing manual workload and minimizing errors. This is especially useful when monitoring numerous KPIs or financial assets.
Automating Correlation with Macros and VBA
Automation is a game-changer for repetitive or complex correlation tasks. By leveraging Excel's VBA editor, you can create macros that calculate correlation coefficients across multiple sheets or files. This is ideal for organizations managing vast data repositories.
A sample VBA snippet for batch correlation might look like:
Sub CalculateCorrelations()
    Dim ws As Worksheet
    Set ws = ThisWorkbook.Sheets("Data")
    ws.Range("D2").Formula = "=CORREL(A2:A101,B2:B101)"
End Sub
Automating how to get correlation coefficient in excel with VBA boosts efficiency and ensures consistency in corporate reporting procedures.
Advanced Data Manipulation with Power Query
Power Query transforms the way you prepare and analyze data before running correlation calculations. It streamlines data cleansing, merging, and reshaping, making it easier to maintain accuracy. If you are working with complex datasets, Power Query can automate data normalization, handle missing values, and structure tables for correlation analysis.
For those interested in elevating their approach, Power Pivot and data modeling in Excel provides a framework for building error-proof, scalable models. Integrating Power Query with Power Pivot enhances your ability to get correlation coefficient in excel for enterprise-scale projects.
Interactive Dashboards for Correlation Insights
Visualizing correlation results through interactive dashboards helps stakeholders grasp complex relationships quickly. By combining slicers, charts, and conditional formatting, you can build dashboards that update in real time as data changes.
For example, a sales manager might use a dashboard to track how advertising spend correlates with regional sales over time. Embedding dynamic scatterplots and heatmaps makes it easier to spot patterns and outliers. This approach to how to get correlation coefficient in excel elevates data storytelling and decision-making.
Real-World Impact and Excel Limitations
Advanced correlation analysis in Excel is instrumental in predictive analytics, from financial forecasting to scientific research. Businesses use these tools to identify leading indicators, reduce risk, and make informed decisions.
However, Excel does have limitations. Handling very large datasets or highly complex statistical models can challenge Excel's performance. In such cases, specialized tools like R or Python may be more appropriate. Still, knowing how to get correlation coefficient in excel with advanced techniques ensures you can maximize Excel's capabilities before transitioning to other platforms.
Expert Tips, Best Practices, and Resources for Excel Correlation Analysis
Mastering how to get correlation coefficient in excel requires more than just knowing the right formulas. It demands careful organization, clear communication, and a commitment to accuracy at every step. Adopting expert best practices can transform your correlation analysis from a basic calculation into a powerful decision-making tool.
Organizing and Documenting Your Analysis
Begin every project by structuring your data tables and labeling columns clearly. Use consistent formats for dates, numbers, and text to avoid confusion. Document every step, including how you prepared your data, the correlation methods used, and any assumptions made.
Apply Excel’s data validation tools to minimize entry errors and maintain data integrity. For a deeper dive on this, explore Excel data validation rules and checks. This ensures your process for how to get correlation coefficient in excel is both reliable and reproducible.
Presenting Results Effectively
Visualization is key. Use scatterplots, heatmaps, and correlation matrices to make your findings accessible to all stakeholders. Annotate your charts with clear legends and concise explanations. Interactive dashboards can help decision-makers explore results on their own.
When presenting, tailor your insights to your audience. Executives may prefer summaries and visuals, while analysts might appreciate detailed tables and formulas. This approach lets you showcase not just the results, but the value of knowing how to get correlation coefficient in excel.
Avoiding Pitfalls and Ensuring Reproducibility
Common mistakes include misinterpreting correlation as causation, overlooking outliers, or failing to document changes. Always double-check your formulas and use version control for your spreadsheets. Maintain a clear workflow so others can follow or audit your steps.
Standardizing your approach guarantees that how to get correlation coefficient in excel remains consistent, especially across teams or repeated analyses. This fosters trust and transparency.
Resources for Mastering Correlation Analysis in Excel
Stay current with new Excel features and best practices. Microsoft’s official documentation, online courses, and user communities offer ongoing learning opportunities. For a comprehensive overview of related techniques, visit Data analysis techniques in Excel.
Leverage templates and add-ins to streamline repetitive tasks. Excel 2026 introduces enhancements for statistical analysis, making correlation calculations faster and more robust.
Real-World Example: Improved Forecasting
A finance team recently improved their sales forecasts by standardizing how to get correlation coefficient in excel. By adopting structured templates, validating their data, and visualizing relationships, they identified key drivers behind revenue changes. This led to more accurate projections and increased confidence in their reports.
Staying disciplined with best practices and resources ensures that your correlation analysis stands up to scrutiny. Whether you’re working solo or leading a team, the right habits make all the difference.