Unlock the full potential of your data in 2025 with excel conditional formats, now more powerful and essential than ever for business and personal productivity.
Whether you are just starting with spreadsheets or are already a data expert, this guide will help you master every aspect of conditional formatting.
You will discover what conditional formatting is, why it is a must-have skill, the newest features for 2025, step-by-step setup instructions, advanced techniques, real-world business applications, and troubleshooting tips.
Explore the latest 2025 updates, learn practical use cases, streamline your workflow, and take action with proven strategies from experts in the field.
Understanding Excel Conditional Formatting: The Fundamentals
Unlocking the power of excel conditional formats starts with understanding the basics. Whether you are new to Excel or seeking to optimize your data analysis, mastering these fundamentals will set you up for success.
What is Conditional Formatting in Excel?
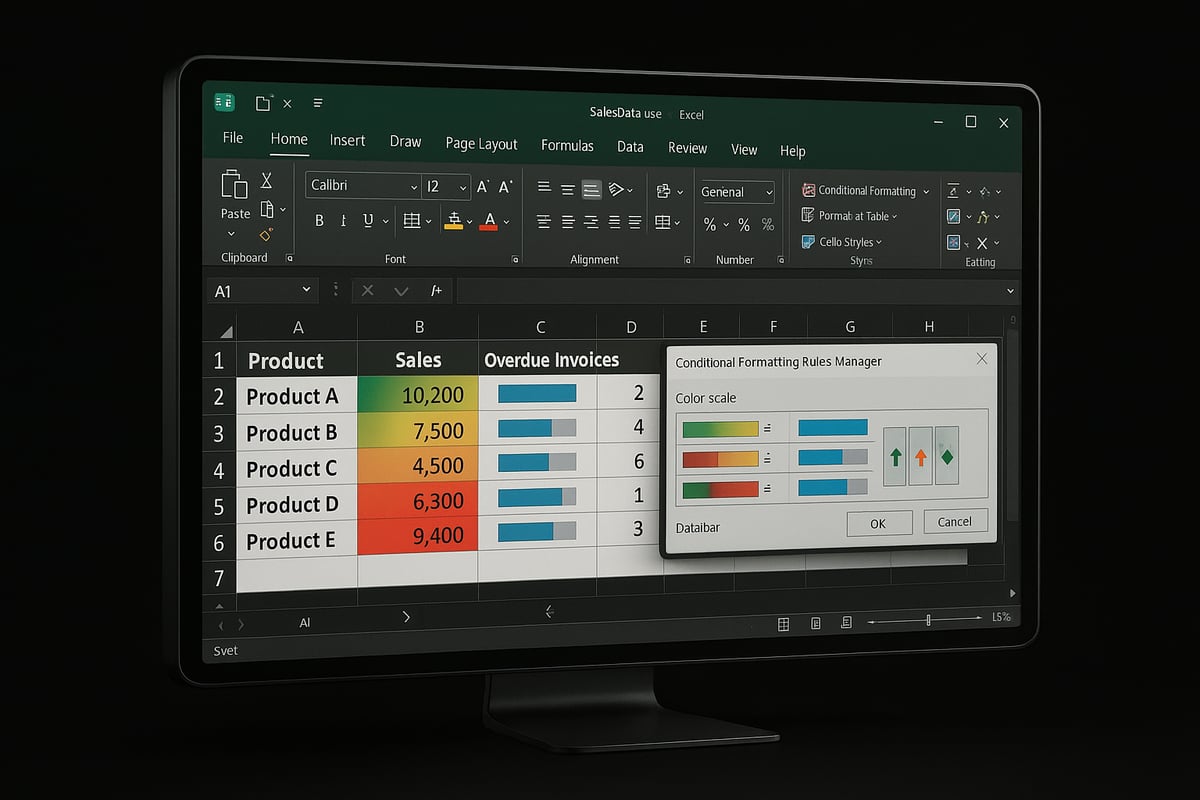
Conditional formatting in Excel is a feature that automatically changes the appearance of cells based on specific criteria. This means you can visually identify trends, outliers, or important information at a glance. For example, if you want overdue invoices to stand out, you can set excel conditional formats to highlight those cells in red.
Unlike manual formatting, which requires you to update each cell individually, conditional formatting adapts instantly as your data changes. This dynamic approach enhances visibility and ensures your spreadsheets always reflect the latest information.
Why Conditional Formatting Matters in 2025
With data volumes on the rise, relying on excel conditional formats has become a critical skill in 2025. Research shows that 65% of people are visual learners, making visual cues essential for quick understanding. In today's business intelligence landscape, decision-makers want actionable insights, not raw numbers.
Picture a sales dashboard where top-performing products are marked green and underperformers are flagged red. Excel conditional formats help you spot issues and opportunities instantly, streamlining analysis for faster, more informed decisions.
Types of Conditional Formatting Rules
Excel conditional formats offer several rule types to address diverse data scenarios. Here is a quick comparison:
| Rule Type | Example Use Case |
|---|---|
| Highlight Cell Rules | Flag sales above target |
| Top/Bottom Rules | Mark top 10 performers |
| Data Bars | Visualize sales volumes |
| Color Scales | Show temperature gradients |
| Icon Sets | Indicate status (up/down/flat) |
| Formula-Based Rules | Custom logic, e.g., weekends |
Using the right rule type lets you tailor your analysis. Formula-based rules, for instance, allow you to use =ISBLANK(A1) or =MOD(ROW(),2)=0 to highlight specific patterns in your data.
Where Conditional Formatting Fits in Modern Workflows
Excel conditional formats are now integral to automated, data-driven workflows. They support decision-making by instantly flagging errors or trends, especially in collaborative environments. Integration with tools like Power Query, Power BI, and Excel Online means your formats adapt as data is updated or shared.
For optimal results, structure your data as Excel tables. This ensures that conditional formatting rules apply consistently, even when new rows are added. Learn more about the benefits of properly structured tables in Creating Excel tables for formatting.
Common Mistakes and Misconceptions
While excel conditional formats are powerful, there are pitfalls to avoid. Overusing formatting can clutter your sheet, making insights harder to find. Failing to update rules when your data structure changes may cause formats to miss new entries.
A common misconception is misunderstanding absolute versus relative references, which can lead to rules not applying as intended. For example, if your formatting is not set up for new rows, recent data might not be highlighted, leaving critical gaps in your analysis.
What’s New in Excel Conditional Formatting for 2025
Excel conditional formats are evolving rapidly in 2025, offering users a more intuitive, flexible, and intelligent way to visualize and analyze data. Let’s explore the key updates that set the latest version apart.
Enhanced User Interface and Experience
The user experience for excel conditional formats has seen a significant upgrade. The redesigned rule manager now allows easier navigation, letting you view, edit, and prioritize rules with fewer clicks.
Live feedback is more robust, offering real-time previews as you tweak rules, so you can instantly see how changes affect your data. For instance, adjusting a color scale immediately updates the spreadsheet, reducing trial and error and saving valuable time.
New Rule Types and Customization Options
In 2025, excel conditional formats introduce AI-driven suggestions that automatically recommend formatting based on detected patterns in your data. Expanded icon sets and an enriched color palette give users more ways to make data stand out.
A game-changing addition is the ability to apply conditional formatting directly to pivot tables and dynamic arrays, allowing for more granular and responsive data visualization. To learn more about these intelligent features, see the AI-Powered Conditional Formatting in Excel 2025 guide.
Integration with Excel 365 and Cloud Features
Excel conditional formats are now deeply integrated with Excel 365 and cloud-based tools. Conditional formatting rules update in real time during collaboration, ensuring consistency across all users’ views of a shared workbook.
Version control has improved, so changes to formatting rules are tracked and reversible. For example, multiple team members can edit a sales dashboard simultaneously, and all conditional formats remain synchronized and accurate.
Performance and Compatibility Updates
Performance has been a major focus for excel conditional formats in 2025. Processing large datasets is faster, with reduced lag even in complex workbooks.
Backward compatibility ensures that you can open and edit files with advanced formatting in older Excel versions without losing critical visual cues. These improvements help teams work efficiently, no matter the workbook size or the version in use.
Step-by-Step: How to Apply Conditional Formatting in Excel
Unlocking the power of excel conditional formats begins with a solid workflow. Each step in this guide brings you closer to creating dynamic, visually engaging spreadsheets that drive better decisions. Let us walk through the process, from preparing your data to managing complex workbooks.
Preparing Your Data for Conditional Formatting
Before you use excel conditional formats, ensure your data is clean and well-structured. Consistency is key—remove duplicates, fix spelling errors, and standardize date or number formats across your tables.
A tidy dataset allows conditional formatting to work as intended. For example, if your sales data contains both "NY" and "New York," rules may not apply consistently. Use Excel’s built-in "Remove Duplicates" and "Text to Columns" tools for efficient prep.
Organize your data into tables. Structured tables automatically expand as you add new rows, ensuring your formatting remains intact. This foundation sets the stage for applying rules effectively.
Creating Basic Conditional Formatting Rules
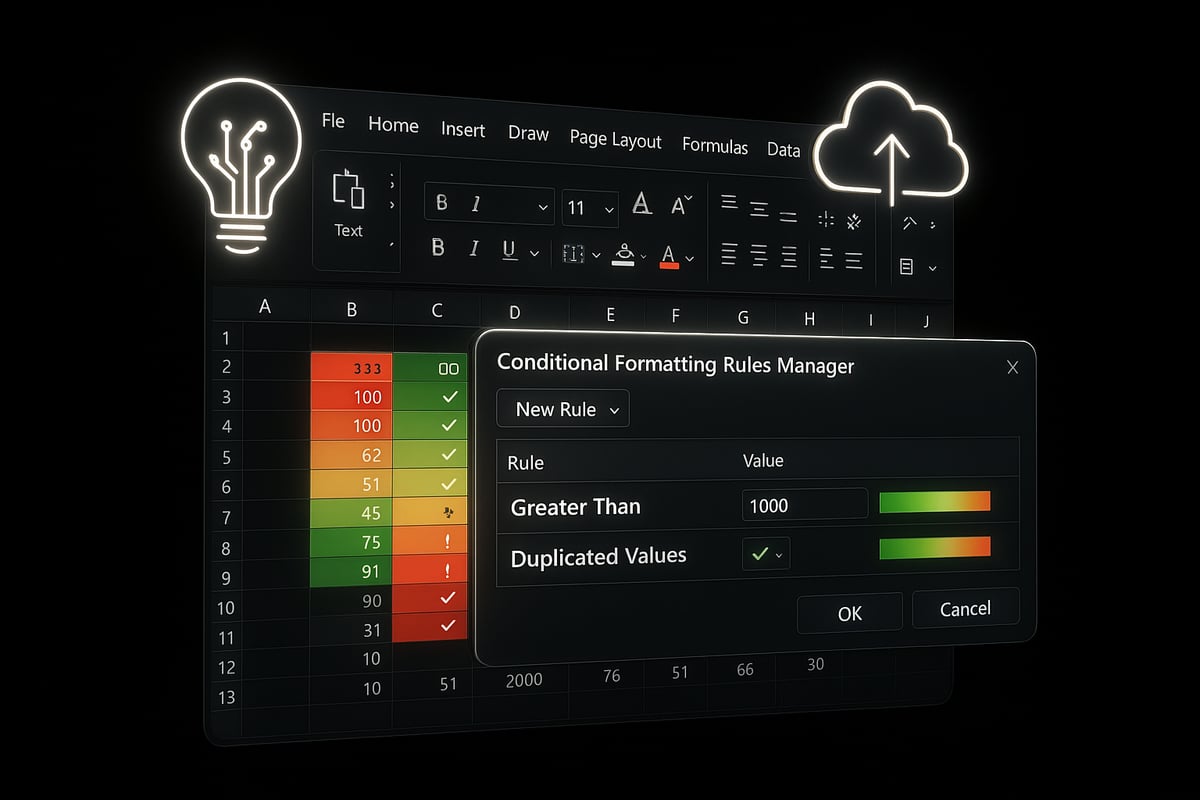
Excel conditional formats offer built-in rules that are both powerful and user-friendly. To start, select the cells you want to format. Navigate to the "Home" tab, click "Conditional Formatting," and choose from options like "Highlight Cell Rules" (greater than, less than), "Top/Bottom Rules," "Data Bars," and "Color Scales."
For example, you can highlight all sales above $10,000 in green. Simply select your range, pick "Highlight Cell Rules," and set your criteria. The preview lets you see changes instantly.
If you want inspiration for more creative uses, check out the Top 5 Ways to Use Conditional Formatting in Excel 2025 for practical techniques on color scales, data bars, and icon sets.
Customizing and Editing Rules
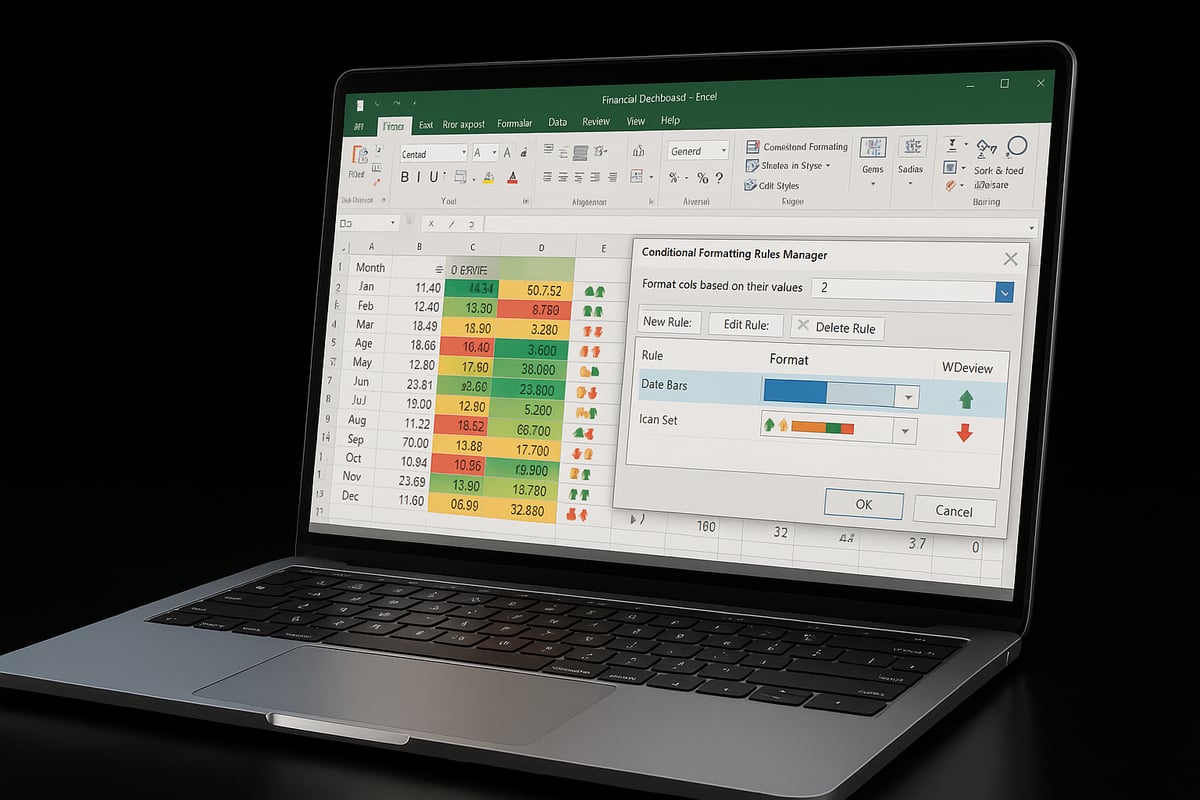
Once your basic excel conditional formats are in place, you may need to fine-tune them. Access the "Manage Rules" option under the Conditional Formatting menu. Here, you can view all rules applied to the current worksheet.
To modify a rule, select it and click "Edit Rule." You can adjust color scales, switch icons, or change thresholds. Use the up and down arrows to prioritize rules—this determines which format applies when multiple rules overlap.
Deleting obsolete rules or updating them for new data structures keeps your spreadsheets clean. Regularly reviewing your rules ensures they remain relevant as your data evolves.
Using Formulas in Conditional Formatting
Formulas unlock the full flexibility of excel conditional formats. Select your range, open the Conditional Formatting menu, and choose "New Rule" followed by "Use a formula to determine which cells to format."
For instance, to highlight blank cells, use =ISBLANK(A2). To shade weekends in a calendar, try =WEEKDAY(A2,2)>5. Remember the difference between absolute ($A$2) and relative (A2) references—relative references adjust as formatting is applied across a range.
Testing formulas on a small sample before applying them broadly helps catch errors early. This approach delivers highly targeted visual cues.
Applying Conditional Formatting to Pivot Tables and Dynamic Arrays
With 2025 updates, excel conditional formats can be directly applied to pivot tables and dynamic arrays. Select your pivot table, choose "Conditional Formatting," and set rules just as you would with normal data.
Dynamic arrays—such as those created with the UNIQUE() or FILTER() functions—can now be formatted even as their size changes. For example, highlight sales above a threshold within a pivot table to flag high performers in real time.
These features support live data analysis, making your dashboards more interactive and responsive to updates.
Managing Conditional Formatting Across Large Workbooks
Scaling excel conditional formats across multiple sheets or large workbooks requires organization. Copy rules between sheets by selecting the formatted range, copying, and using "Paste Special" with "Formats" selected.
Named ranges allow you to apply consistent formatting across related data, even as your workbook grows. If you encounter conflicting rules or formatting that does not apply to new data, use the "Manage Rules" window to troubleshoot and adjust range references.
Regularly cleaning up and documenting your rules keeps your workbooks efficient and easy to maintain, especially in collaborative environments.
Advanced Conditional Formatting Techniques for Power Users
Unlocking the full potential of excel conditional formats requires mastering advanced techniques that go beyond basic highlighting. Dive into the strategies below to elevate your data analysis and reporting in 2025.
Layering Multiple Rules for Data Insights
Layering multiple excel conditional formats allows you to extract deeper insights from your data. By stacking rules, you can visualize several attributes at once, such as sales performance and regional trends.
For example, you might apply a green fill to top-performing sales regions, while overlaying red icons for locations that missed their targets. The order of your rules matters, as higher-priority rules override lower ones.
Best practices for layering:
- Arrange rules by importance in the rule manager.
- Use contrasting color schemes for clarity.
- Test combinations on sample data first.
This approach helps you quickly spot patterns and outliers, making your reports more actionable.
Conditional Formatting with VBA and Macros
Automating excel conditional formats with VBA scripts or macros saves time and ensures consistency across reports. With VBA, you can apply complex rules to large datasets or automate formatting for recurring reports.
Consider this example macro for monthly financial reports:
Sub ApplyConditionalFormatting()
    With Range("B2:B100")
        .FormatConditions.Add Type:=xlCellValue, Operator:=xlGreater, Formula1:="=10000"
        .FormatConditions(1).Interior.Color = RGB(144, 238, 144)
    End With
End Sub
Remember to review security settings before running macros. Automating conditional formatting is ideal for organizations handling frequent, large-scale data updates.
Dynamic Formatting with Linked Data and External Sources
Excel conditional formats can adapt automatically when linked to external data sources through Power Query or database connections. This means your formatting updates in real time as new data flows in.
For instance, a stock portfolio tracker can highlight assets above or below target thresholds as market data refreshes. Dynamic arrays in Excel 2025 now allow conditional formatting to expand or contract with data, ensuring your visuals stay relevant.
To maximize this feature:
- Use named ranges for dynamic data.
- Refresh external connections regularly.
- Test formatting on both static and live data.
Conditional Formatting for Dashboards and Reports
Applying excel conditional formats to dashboards enhances readability and makes key metrics stand out. Use icon sets for KPIs, color scales for trends, and data bars to visualize progress.
On an executive dashboard, you might use warning icons for at-risk projects and green data bars for sales nearing targets. The new 2025 features allow direct formatting in pivot tables, so you can highlight critical data points instantly.
Tips for dashboard conditional formatting:
- Limit the number of colors and icons for clarity.
- Align formatting with your organization's branding.
- Preview rules to avoid clutter.
Troubleshooting Complex Conditional Formatting Scenarios
Complex excel conditional formats can sometimes conflict or fail to apply as expected. Common issues include overlapping rules, incorrect range references, or formula errors.
Use the "Show Formatting Rules" feature to diagnose problems and ensure rules are applied in the intended order. If you encounter persistent issues, consult Excel troubleshooting tips for step-by-step solutions tailored to advanced formatting challenges.
Stay proactive by documenting your rules and regularly reviewing them after data or structural changes.
Performance Optimization Tips
Efficient use of excel conditional formats is essential for maintaining workbook speed, especially with large datasets. Avoid volatile functions, and keep rules simple whenever possible.
Here is a quick reference table for optimizing performance:
| Tip | Impact |
|---|---|
| Limit rules per worksheet | Faster calculations |
| Use named ranges | Easier management |
| Avoid entire-column ranges | Reduced lag |
| Test on sample data | Early detection |
Optimizing your formatting ensures smooth monthly financial reporting and a better user experience.
Expert Help: The Analytics Doctor
When you face complex excel conditional formats that affect productivity or accuracy, expert help can make all the difference. The Analytics Doctor specializes in custom rule creation, troubleshooting, and tailored Excel training.

By leveraging professional services, you benefit from faster workflows, reduced errors, and ongoing support for your business or team. Whether you need intricate conditional formatting for dashboards or large-scale automation, expert guidance ensures your solutions are robust and future-ready.
Real-World Applications: Conditional Formatting in Business and Data Analysis
Excel conditional formats are transforming how businesses interpret and act on data. In every department, these tools provide clarity, drive efficiency, and support better decisions. Let us explore how different business functions leverage excel conditional formats for real-world impact.

Financial Modeling and Budget Tracking
In finance, excel conditional formats are essential for highlighting budget variances, expense overruns, and critical financial KPIs. Imagine a budget sheet where any category exceeding its limit turns red, while savings targets achieved glow green. This immediate feedback streamlines decision-making.
Finance teams rely on visual cues to spot anomalies quickly. For instance, a cash flow model can use color scales to indicate risk, helping prioritize corrective action. According to an industry survey, 72% of finance teams use Excel for budgeting. For more strategies, explore financial modeling with Excel.
Sales and Marketing Dashboards
Sales and marketing professionals utilize excel conditional formats to visualize targets, trends, and pipeline health. By color-coding opportunities by deal stage or highlighting underperforming products, teams instantly spot where to focus efforts.
A sales dashboard might use icon sets to flag deals that need immediate attention or color scales to show which regions are outperforming others. Teams using visual dashboards are 28% more likely to hit their targets thanks to these instant insights. This approach makes performance management more proactive and data-driven.
Project Management and Task Tracking
Excel conditional formats help project managers track timelines, status, and critical tasks. Gantt charts become more actionable when tasks nearing deadlines are highlighted in orange or overdue items in red, allowing for quick intervention.
Status indicators, such as in-progress, completed, or blocked, can be visualized with icon sets. This keeps teams aligned and ensures that at-risk tasks do not slip through the cracks. Automated formatting enhances transparency and accountability across all stakeholders.
HR and Workforce Analytics
HR departments leverage excel conditional formats for monitoring attendance, tracking overtime, and analyzing workforce diversity. For example, employees approaching overtime limits can be instantly flagged, helping managers prevent burnout and control costs.
Performance data, such as training completion or evaluation scores, can be color-coded for easy review. With 54% of HR teams using Excel for analytics, conditional formatting ensures that important trends and exceptions are never missed, supporting a data-informed HR strategy.
Data Cleaning, Quality Control, and Error Detection
Data quality is critical for every business process. Excel conditional formats make it simple to flag duplicates, highlight missing values, and spot outliers during audits. This reduces manual review time and improves reliability.
Companies report audits are 30% faster when automated formatting is used to identify errors. Ready-to-use resources like Excel templates for reports can help implement best practices and accelerate error detection. These solutions ensure your data is clean, trustworthy, and always ready for analysis.
Troubleshooting and Best Practices for Conditional Formatting in Excel
Keeping your spreadsheets accurate and visually clear depends on mastering both troubleshooting and best practices for excel conditional formats. Even experienced users encounter issues, but with the right strategies, you can resolve them quickly and maintain reliable formatting across your workbooks.
Common Issues and How to Fix Them
Even the most carefully applied excel conditional formats can stop working as expected. Common problems include formatting not applying to new data, conflicting rules, or rules not updating when the table expands.
Some typical issues and quick fixes:
- Formatting not applying to new rows: Check that your format range includes the entire table, not just a static selection.
- Rules conflicting: Use the Rule Manager to review priority and adjust as needed.
- References not updating: Convert your data to a structured table so excel conditional formats expand automatically.
For example, when formatting does not apply to new data, update your range reference from A2:A10 to A2:A100 or use a table to ensure future entries are covered.
Best Practices for Sustainable Formatting
To keep excel conditional formats manageable and effective, follow these best practices:
- Keep rules simple and organized: Too many rules can slow down your workbook and make troubleshooting harder.
- Document your rule logic: Use comments or a separate sheet to explain the purpose of each rule, making team handovers seamless.
- Use templates: Standardize your formatting by creating reusable templates for common tasks.
A well-organized approach ensures your excel conditional formats stay consistent and easy to maintain, even as your data grows or your team changes.
Future-Proofing Your Conditional Formatting Skills
Excel is always evolving, so staying ahead is key for anyone relying on excel conditional formats. Keep your skills sharp by following new releases, engaging with the Excel community, and building a library of reusable rules.
Tap into official resources like Microsoft Learn, forums, and specialized courses. For comprehensive, up-to-date learning, the In-Depth Excel Conditional Formatting Course covers everything from basics to advanced techniques.
By investing in your knowledge, you ensure your excel conditional formats remain efficient and compatible with future versions.