2025 is the year to take control of your data. Excel remains the world’s most powerful spreadsheet tool, relied on by millions for business, school, and personal projects.
If you have ever felt overwhelmed by doing excel, this essential guide is for you. We will break down everything you need, from the basics of setup and navigation to powerful tips for saving time.
You will explore Excel’s modern interface, learn functions both simple and advanced, and discover how to visualize your data with confidence. No jargon or guesswork—just clear, actionable steps designed for absolute beginners.
Ready to master Excel in 2025? Follow along and unlock the secrets to rapid, stress-free spreadsheet success.
Getting Started with Excel: Installation, Setup, and Navigation
Starting your journey with Excel in 2025 is easier than ever. Whether you’re a student, professional, or simply curious about doing excel for personal projects, this section walks you through every foundational step.

Understanding Excel Versions in 2025
Excel continues to evolve, and knowing which version suits your needs is the first step to doing excel efficiently. In 2025, you’ll find three primary options:
| Version | Key Features | Ideal For |
|---|---|---|
| Office 365 | Real-time collaboration, AI tools, always updated | Teams, frequent users |
| Excel 2021 | One-time purchase, offline use | Individuals, small orgs |
| Excel for the web | Free, cloud-based, accessible | Quick edits, mobile users |
The 2025 editions introduce enhanced automation, smarter data visualization, and improved compatibility across devices. For example, Office 365’s real-time co-authoring lets multiple people edit a file together seamlessly, making doing excel more collaborative than ever.
Installing and Launching Excel
Getting Excel up and running is straightforward. Start by downloading the installer for your platform—Windows, Mac, or simply access Excel for the web via your browser. Follow the on-screen steps to install. If you’re new to doing excel, consider using the free trial or check if your school or workplace offers a license.
Licensing options include monthly subscriptions (Office 365) or a one-time purchase (Excel 2021). If installation fails, double-check your internet connection, system requirements, or restart your device. Troubleshooting guides are available within the installer or on Microsoft’s support site.
Navigating the Excel Interface
Once Excel is open, you’ll see the Ribbon at the top, packed with commands sorted into tabs like Home, Insert, and Data. The Quick Access Toolbar sits above, offering fast access to favorite tools. Worksheet tabs appear at the bottom, letting you switch between different sheets in your file.
Customizing your workspace can boost productivity when doing excel. You can pin frequently used commands to the Ribbon or the Quick Access Toolbar for instant access. Try right-clicking any command and choosing “Add to Quick Access Toolbar” to personalize your setup.
Creating and Saving Your First Workbook
Ready to create your first file? Click “New Workbook,” then give it a meaningful name. To save, select “Save As,” pick a location, and choose a format—XLSX for standard workbooks, XLS for legacy compatibility, CSV for data exchange, or PDF for sharing.
Cloud storage is a game-changer for doing excel in 2025. Saving your workbooks to OneDrive or SharePoint means you can access them from any device and collaborate in real time. This also adds a layer of backup, protecting your data from unexpected loss.
Excel Templates and When to Use Them
Excel’s built-in templates jumpstart your projects. Whether you need a budget planner, calendar, or invoice, templates save time and reduce setup hassle. Explore community resources for even more options.
For example, if you’re doing excel for personal finance, start with a personal budget template. Just open Excel, search “budget” in the template gallery, and customize fields for your needs. Templates help you focus on your data, not formatting.
Essential Keyboard Shortcuts for Beginners
Mastering shortcuts is a secret weapon for anyone doing excel. Here are some essentials:
Ctrl + Cto copyCtrl + Vto pasteCtrl + Zto undoCtrl + Sto saveCtrl + Arrow Keysto navigateCtrl + Shift + Lto add filtersCtrl + Nfor a new workbookCtrl + Fto findCtrl + Pto printF2to edit cell
Using shortcuts speeds up your workflow and minimizes repetitive mouse clicks. According to Microsoft’s official shortcut statistics, users who regularly use shortcuts complete their tasks up to 30% faster. For a deeper dive, the Beginner Excel Training Guide offers step-by-step resources tailored to new users.
Entering, Formatting, and Managing Data
Getting comfortable with entering, formatting, and managing data is the backbone of doing excel effectively. Whether you are tracking sales, managing inventories, or building reports, mastering these essentials will set you up for success.
Inputting Data: Cells, Rows, and Columns
The first step in doing excel is learning how to work with cells, rows, and columns. Select a cell by clicking on it, then type your data. Press Tab to move right or Enter to move down. You can edit any cell by double-clicking or pressing F2.
To add or delete rows and columns:
- Right-click the row number or column letter.
- Select "Insert" or "Delete" from the menu.
Example: Enter monthly sales in a column, then add rows for each month. For more tips on efficient data entry and management, check out Excel Data Entry and Management.
Formatting Basics: Fonts, Colors, and Styles
Formatting brings your data to life and makes your spreadsheet easier to read. Start by selecting your cells, then use the Ribbon to:
- Change font type and size
- Adjust cell background color
- Apply bold, italics, or underline
For quick styling, use built-in cell styles. Conditional formatting highlights trends, like increasing sales. For example, you can automatically color cells above a certain value. Doing excel with smart formatting saves time and helps you communicate data clearly.
Data Types and Validation
Excel recognizes several data types, such as numbers, text, dates, and currency. Use the Number Format menu to set each cell's type. This ensures correct calculations and sorting.
To prevent data entry mistakes, use Data Validation:
- Select the cells you want to restrict.
- Go to Data > Data Validation.
- Choose rules (e.g., only whole numbers).
Example: Limit a column to only accept dates. Data validation is a key part of doing excel right, as it keeps your information accurate.
Sorting and Filtering Data
Sorting and filtering help you make sense of large datasets. To sort, select your range and click "Sort & Filter" on the Ribbon. Choose alphabetical, numerical, or custom order.
Filtering lets you display only the data you need. Click the filter icon in the column header and pick your criteria.
Example: Sort your product inventory from A-Z or filter to show only items in stock. Doing excel well means knowing how to quickly find and organize the data that matters.
Using Find and Replace
Find and Replace is a powerful tool for navigating big spreadsheets. Press Ctrl + F to find any value, or Ctrl + H to replace it.
Tips for safe replacing:
- Always double-check your search criteria.
- Preview changes before applying them to avoid mistakes.
When doing excel, efficient searching and replacing saves hours, especially in large datasets.
Managing Worksheets and Workbooks
A workbook can contain multiple worksheets. Add a new sheet with the "+" tab, rename by double-clicking the tab, and drag to reorder.
To group worksheets for batch actions, hold Ctrl and click each tab. You can also move or delete sheets as needed.
Example: Organize a monthly report workbook by creating separate sheets for each month. Managing sheets is essential for anyone doing excel regularly.
Protecting and Sharing Your Data
Excel lets you protect your hard work. Set passwords for sheets or entire workbooks under Review > Protect. You can also restrict editing permissions for collaborators.
Sharing is simple with cloud tools like OneDrive or SharePoint. Click "Share" to invite others, set permissions, and collaborate in real time.
When doing excel in 2025, these features ensure your data stays secure while remaining accessible to your team.
Mastering Formulas and Functions: The Heart of Excel
Formulas and functions are what truly set Excel apart. If you’re doing excel for the first time, this is where the magic happens—turning raw data into real answers. Let’s break down the essentials so you can start calculating, analyzing, and automating with confidence.

Introduction to Formulas: Syntax and Structure
Every journey in doing excel starts with understanding formulas. In Excel, formulas always begin with an equals sign (=). You combine cell references, numbers, and operators like +, -, *, and / to perform calculations.
Order matters! Excel follows the PEMDAS rule: parentheses, exponents, multiplication/division, then addition/subtraction. For example:
= (A1 + B1) * C1
This formula adds A1 and B1, then multiplies the result by C1. Once you get comfortable with the basics, you’ll find that doing excel calculations becomes second nature.
Essential Functions Every Beginner Should Know
Functions are built-in formulas that save tons of time when doing excel. Here are five you’ll use constantly:
| Function | Purpose | Example Usage |
|---|---|---|
| SUM | Adds numbers | =SUM(A1:A5) |
| AVERAGE | Calculates mean | =AVERAGE(B1:B10) |
| COUNT | Counts cells with numbers | =COUNT(C1:C100) |
| MIN | Finds lowest value | =MIN(D1:D10) |
| MAX | Finds highest value | =MAX(E1:E10) |
Imagine you’re tracking sales. SUM totals your revenue, while COUNT helps you see how many transactions you had. Microsoft’s stats show these are the most-used functions, proving their value for anyone doing excel.
Relative vs. Absolute Cell References
When doing excel, cell references can be relative (A1), absolute ($A$1), or mixed (A$1 or $A1). Relative references change as you copy a formula, which is great for repetitive calculations. Absolute references stay fixed, perfect when you always need to refer to one cell.
Example: Copying =A1*B1 down a column updates to =A2*B2, =A3*B3, and so on. If you want to lock a tax rate in cell C1, use =A1*$C$1. Mastering this distinction saves countless hours when doing excel.
Using AutoFill and Flash Fill for Efficiency
Speed matters when doing excel. AutoFill lets you drag the fill handle to copy formulas or continue patterns, like months or numbers. Flash Fill automatically recognizes data patterns and fills in the rest for you.
For example, if you have full names in one column, type the first name in the next column. Flash Fill will suggest the rest. It’s a game-changer for cleaning and splitting data, making doing excel much faster and easier.
Common Formula Errors and How to Fix Them
Everyone encounters formula errors when doing excel. Here are three you’ll see most:
#VALUE!– Wrong data type (like text instead of numbers)#DIV/0!– Division by zero#REF!– Invalid cell reference
To fix these, double-check your cell references and data types. If you’re stuck, Fixing Excel Formula Errors offers clear steps for beginners to troubleshoot and resolve these common mistakes. This guide is a must-have for anyone serious about doing excel right.
Introduction to Logical Functions: IF, AND, OR
Logical functions let you make decisions in your spreadsheet, which is essential for doing excel like a pro. The IF function returns one value if a condition is true and another if false.
Example grading system:
=IF(A1>=90, "A", IF(A1>=80, "B", "C"))
You can combine IF with AND/OR for more complex rules. Doing excel with logical formulas helps you automate grading, reporting, and more—no manual sorting required.
Tips for Auditing and Debugging Formulas
Even seasoned pros make mistakes when doing excel. Use the Formula Auditing tools on the Ribbon to trace precedents (cells feeding into a formula) and dependents (cells affected by a formula).
If a payroll calculation seems off, use “Evaluate Formula” to step through it piece by piece. These tools help you spot errors quickly, ensuring your doing excel journey is smooth and reliable.
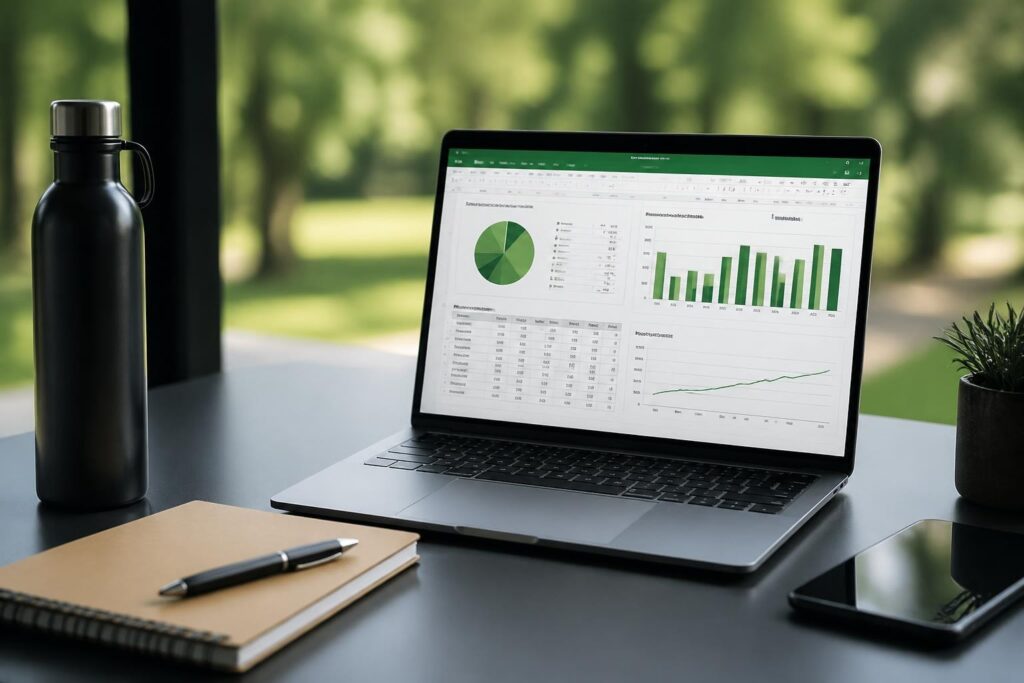
Visualizing Data: Charts, Graphs, and Conditional Formatting
Unlocking the full potential of your data starts with seeing it clearly. When doing excel, visualizing information transforms numbers into insights, making trends and patterns easier to spot. Whether you are preparing a business report, tracking personal finances, or presenting a project, Excel’s data visualization tools are essential.
Creating Basic Charts and Graphs
Charts bring your numbers to life. In doing excel, start by selecting your data range, then click “Insert” and choose from bar, column, or pie charts. Each type serves a unique purpose:
- Bar/Column charts: Great for comparing categories.
- Pie charts: Show proportions within a whole.
- Line charts: Track changes over time.
For example, visualize monthly sales by selecting your data and inserting a column chart. In Excel 2025, chart suggestions have improved, making it even easier for beginners. For a full list of updates, see What's New in Excel (May 2025). Experiment with different chart types to find the best fit for your story.
Customizing Chart Elements
Once your chart is created, customization is key. Doing excel well means making charts clear and compelling. You can:
- Edit chart titles for context.
- Adjust legends for readability.
- Change colors to highlight trends.
- Add data labels for clarity.
- Insert trendlines to show direction.
For example, enhance a budget chart by updating the title to “2025 Monthly Expenses” and using distinct colors for each category. Small tweaks can make your visuals stand out and communicate your message instantly.
Conditional Formatting for Instant Insights
Conditional formatting is a powerful tool in doing excel that highlights important data automatically. You can:
- Use color scales to show value ranges.
- Apply data bars to visualize magnitude.
- Add icon sets for status indicators.
- Highlight top or bottom values.
For instance, create a heatmap to track employee attendance by applying color scales to the attendance column. Patterns emerge instantly, helping you spot absences or high performers.
Sparklines and Mini-Charts
Sparklines are tiny charts that fit inside a single cell. Doing excel with sparklines lets you summarize trends without cluttering your sheet. To insert, select your data, go to “Insert,” and choose “Sparklines.”
- Line sparklines show trends over time.
- Column sparklines compare values.
- Win/Loss sparklines highlight positive or negative results.
For example, add a sales trend sparkline next to each salesperson’s monthly totals to see performance at a glance. Sparklines offer quick visual context without needing a full chart.
Inserting and Formatting Images and Shapes
Enhance your worksheets visually by adding images and shapes. When doing excel, you can:
- Insert company logos for branding.
- Add photos for project reports.
- Use shapes to emphasize key figures or sections.
To format, select the image or shape, then use the “Format” tab to align, resize, or layer elements. For instance, insert your company logo in the report header for a professional touch. Well-placed visuals boost engagement and credibility.
Printing and Exporting Visual Reports
Sharing your work is easier when it looks great on paper and screen. Doing excel includes:
- Setting print areas to focus on key visuals.
- Adjusting page layout for optimal fit.
- Exporting charts and reports to PDF for easy sharing.
For example, create a print-ready invoice by selecting your data, adjusting margins, and exporting to PDF. This ensures your charts and tables look sharp and professional, no matter how you share them.
Accessibility and Best Practices for Visual Data
Making visuals accessible is essential in doing excel, especially for diverse audiences. Follow these best practices:
- Use high-contrast colors for readability.
- Add alt text to images and charts for screen readers.
- Choose descriptive labels and titles.
- Consider colorblind-friendly palettes.
Excel supports accessibility standards like WCAG, helping everyone engage with your data. Prioritize clarity, simplicity, and inclusivity in every visual you create.
Time-Saving Tools and Automation for Beginners
Unlocking time-saving tools is the secret to mastering doing excel in 2025. Automation features in Excel empower you to breeze through repetitive tasks, reduce manual errors, and get more done in less time. Whether you are managing finances, tracking projects, or analyzing sales, these built-in tools transform how you work and help you focus on what matters most.
Introduction to Excel’s Automation Features
Automation is at the heart of doing excel efficiently. In 2025, Excel’s automation options are more powerful and accessible than ever. Features like automated calculations, smart suggestions, and task shortcuts help you save time and eliminate repetitive work.
For example, you can automate monthly expense reports, letting Excel handle calculations and formatting with a click. Automation not only boosts productivity but also minimizes data entry mistakes. If you want to explore more, check out Excel Automation for Beginners for practical tips and tools.
Using AutoSum, Quick Analysis, and Smart Fill
AutoSum is a classic tool for doing excel faster. Just select your data and click the AutoSum button to instantly total up rows or columns. Quick Analysis takes this a step further by offering one-click formatting, charts, and totals based on your selection.
Smart Fill recognizes patterns and fills data automatically. For instance, if you start typing initials from full names, Smart Fill can complete the rest. These features are perfect for beginners aiming to streamline tasks and make doing excel less overwhelming.
Want to stay updated on the latest shortcuts and AI-powered features? Read about 5 Excel Improvements Microsoft Announced in 2025 to supercharge your workflow.
Introduction to Tables and Structured References
Tables are a cornerstone for anyone doing excel. Converting a data range into a table (Ctrl+T) brings powerful benefits: automatic filtering, easy formatting, and structured references that make formulas more readable.
For example, a sales table automatically expands as you add more data. Structured references like =SUM(Table1[Amount]) replace confusing cell ranges. This approach reduces errors and keeps your spreadsheets dynamic and organized.
| Feature | Benefit |
|---|---|
| Automatic Filtering | Find data quickly |
| Structured References | Clearer formulas |
| Dynamic Ranges | Auto-update with data |
Using tables is an essential skill for doing excel efficiently.
Sorting and Filtering with Slicers
Slicers make sorting and filtering data in tables or PivotTables visual and interactive. Instead of clicking drop-down menus, you can just tap on slicer buttons to instantly segment your data.
For example, in doing excel for a product dashboard, add a slicer to filter sales by region or category. This not only saves time but also makes your reports more user-friendly and visually appealing. Slicers are especially useful for quick data exploration and presentations.
Recording and Running Macros (Beginner Level)
Macros are mini-programs that automate repetitive tasks in Excel. Recording a macro is as simple as clicking “Record Macro,” performing your steps, and saving the macro for future use. This is a game-changer for those doing excel regularly, as you can automate formatting, calculations, or routine data imports.
Here’s a basic VBA macro example that formats a selected range as bold:
Sub BoldSelection()
    Selection.Font.Bold = True
End Sub
Always be cautious when enabling macros, especially from unknown sources, to keep your files secure. For a deeper dive into automation, revisit Excel Automation for Beginners.
Collaboration Features: Comments, Notes, and Co-Authoring
Collaboration is essential when doing excel in teams or classrooms. Excel 2025 supports real-time co-authoring, letting multiple users edit the same workbook simultaneously. You can add comments and notes to cells, making it easy to communicate insights or request changes.
For example, a team project tracker lets everyone contribute updates and feedback in one place. These tools make working together seamless and ensure everyone stays on the same page. Embrace collaboration to get the most out of your Excel experience.
Expert Support and Learning Resources for Excel Beginners
Getting the right support can make all the difference when you are doing excel for the first time. With so many resources available, knowing where to look can save you hours of frustration and help you build confidence step by step.
Finding Reliable Help: Official and Community Resources
When you are just starting with doing excel, the official Microsoft Excel support site is a goldmine. It offers step-by-step tutorials, troubleshooting guides, and regular updates. For more personal help, online forums like the Microsoft Community, Stack Overflow, and Reddit’s r/excel are filled with users ready to answer your questions.
YouTube channels dedicated to Excel, such as ExcelIsFun and Leila Gharani, provide clear video walkthroughs. Blogs and community sites often post solutions for common issues, so do not hesitate to search for your problem. Getting involved in these communities is a great way to learn and stay motivated.
Recommended Online Courses and Certifications
If you want a structured path to doing excel, consider enrolling in a beginner-friendly online course. Platforms like Coursera, Udemy, and LinkedIn Learning offer highly rated courses that take you from basics to advanced skills. Many courses are free, while others provide certificates for a fee.
Microsoft also offers its own certification pathways, which are respected by employers and help track your progress. Look for reviews and course previews before committing to a program. Choosing the right course can make your learning journey much smoother.
Joining Excel Communities and User Groups
Learning is easier when you are part of a community. Joining Excel user groups, both virtual and local, connects you with others doing excel at all levels. These groups often host webinars, Q&A sessions, and networking events that can fast-track your skills.
LinkedIn has active Excel groups where professionals share tips and job opportunities. Check for local meetups or virtual events in your area. Participating in these groups helps you stay up to date and motivated.
The Analytics Doctor: Personalized Excel Training and Support
For those who want hands-on help with doing excel, The Analytics Doctor offers tailored support for all skill levels. Services include custom spreadsheet solutions, workflow automation, and troubleshooting. You can book personalized training or join a workshop designed to address your specific needs.

This service is ideal for individuals or organizations aiming to improve efficiency and confidence in Excel. With a highly-rated expert available worldwide, you get direct answers and practical solutions. Visit the site to learn how to get started with a free consultation.
Tips for Continuous Learning and Practice
Becoming skilled at doing excel is a journey. Set clear learning goals—such as mastering formulas or creating charts—and track your progress. Practice using real-world datasets like budgets or sales reports.
Use Excel’s “Tell Me” feature to quickly find tools, and explore the “Ideas” feature for instant data analysis suggestions. Practicing regularly helps you retain skills and discover new shortcuts.
Staying Updated: What’s New in Excel 2025?
Excel is always evolving, so staying informed is crucial for anyone doing excel regularly. Subscribe to Microsoft’s update channels and consider joining the Office Insider program for early access to new features.
To keep pace with the latest developments, check out Here Are All the New Features Microsoft Added to Excel in July 2025, which summarizes the most recent updates. Staying current ensures you always work smarter, not harder.