Microsoft's integration of artificial intelligence into Excel through Copilot has fundamentally changed how professionals approach recurring reports and data analysis tasks. For anyone who has spent countless hours formatting tables, writing repetitive formulas, or manually updating dashboards each week or month, the ability to automate Excel reports with Copilot represents a significant productivity breakthrough. This technology allows you to communicate with Excel using plain English commands, transforming complex multi-step processes into simple conversational requests. Whether you manage monthly sales summaries, weekly performance dashboards, or quarterly financial analyses, understanding how to leverage Copilot's automation capabilities can reduce hours of manual work into minutes of guided oversight.
Understanding Copilot's Reporting Capabilities
Before diving into automation workflows, you need to understand what Copilot can and cannot do within Excel's reporting environment. Copilot operates as an AI assistant embedded directly into your spreadsheet interface, capable of interpreting natural language instructions and executing corresponding actions on your data.
The technology excels at pattern recognition, formula generation, and data transformation tasks. When you ask Copilot to "summarize sales by region" or "create a month-over-month comparison," it analyzes your data structure, identifies relevant columns, and generates appropriate formulas or PivotTables. Getting started with Copilot in Excel requires understanding both its strengths and limitations.
Key Automation Features
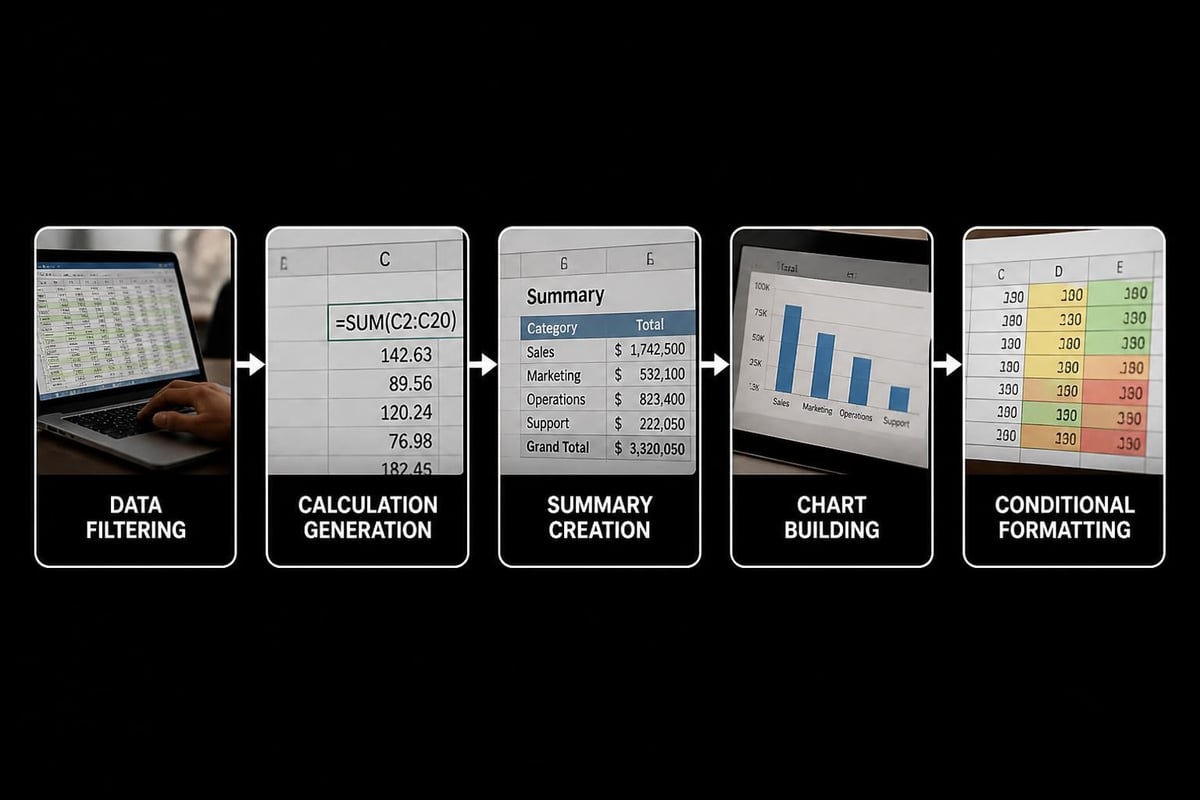
Copilot offers several features specifically designed for report automation:
- Formula generation based on descriptive requests
- Automatic column creation with calculated values
- Data summarization through natural language queries
- Chart and visualization creation from text prompts
- Conditional highlighting and formatting rules
- Pattern detection for trends and outliers
These capabilities work together to transform raw data into polished reports with minimal manual intervention.
Setting Up Your Workbook for Automation
Successful automation begins with proper data organization. Copilot performs best when working with structured data that follows Excel best practices.
Data Structure Requirements
Your source data should be formatted as an Excel table rather than a simple range. This provides Copilot with clear column headers and defined data boundaries. To convert your range to a table, select your data and press Ctrl+T, ensuring the "My table has headers" option is checked.
Essential preparation steps:
- Remove merged cells from your data range
- Ensure each column has a unique, descriptive header
- Eliminate empty rows or columns within the data
- Format dates consistently using Excel's date format
- Remove any subtotals or summary rows from raw data
Clean, well-structured data allows Copilot to accurately interpret your requests and generate reliable outputs. Similar to spreadsheet automation with Claude, preparing your data foundation is critical for AI-assisted workflows.
Naming Conventions and References
Establish consistent naming patterns for your worksheets and data ranges. When you automate Excel reports with Copilot, clear names help the AI understand which data you're referencing. Name your source data table something descriptive like "SalesData" or "CustomerTransactions" rather than leaving it as the default "Table1."
| Element Type | Poor Name | Better Name | Best Name |
|---|---|---|---|
| Worksheet | Sheet1 | Sales | MonthlySalesData |
| Table | Table1 | Data | Q1_CustomerOrders |
| Range | Range1 | Totals | RegionalSalesTotals |
Building Automated Monthly Reports
Monthly reporting represents one of the most time-consuming yet repetitive tasks in business analysis. The Coursera guided project on automating monthly reports demonstrates practical workflows, but understanding the underlying principles allows you to customize automation for your specific needs.
Creating Dynamic Summary Columns
Instead of manually calculating metrics each month, instruct Copilot to generate formulas that automatically update. For example, if you need to calculate profit margins, you might prompt: "Add a column called Profit Margin that calculates (Revenue minus Cost) divided by Revenue as a percentage."
Copilot will insert the appropriate formula and apply it to all rows in your table. The formula remains dynamic, automatically calculating for new data you add later.
Common calculations to automate:
- Growth rates comparing current to previous periods
- Running totals and cumulative sums
- Percentage of total calculations
- Variance analysis between actual and budget
- Year-over-year or month-over-month changes
Generating Insight Summaries
One of Copilot's most powerful features is its ability to generate data insights through conversational queries. Rather than manually analyzing data to identify trends, you can ask questions like "What were the top three performing products last month?" or "Show me any unusual patterns in customer orders."
Copilot processes your data and returns text-based insights along with supporting calculations. This feature is particularly valuable for executive summaries or report narratives that accompany your data tables and charts.
Advanced Automation with Agent Mode
For users ready to move beyond single-task automation, Excel's Agent Mode enables multi-step workflows executed from a single prompt. This capability is especially powerful when you automate Excel reports with Copilot on a recurring schedule.
Setting Up Complex Workflows
Agent Mode allows you to chain together multiple operations. The step-by-step tutorial on Agent Mode explains how to structure prompts that execute sequential tasks.
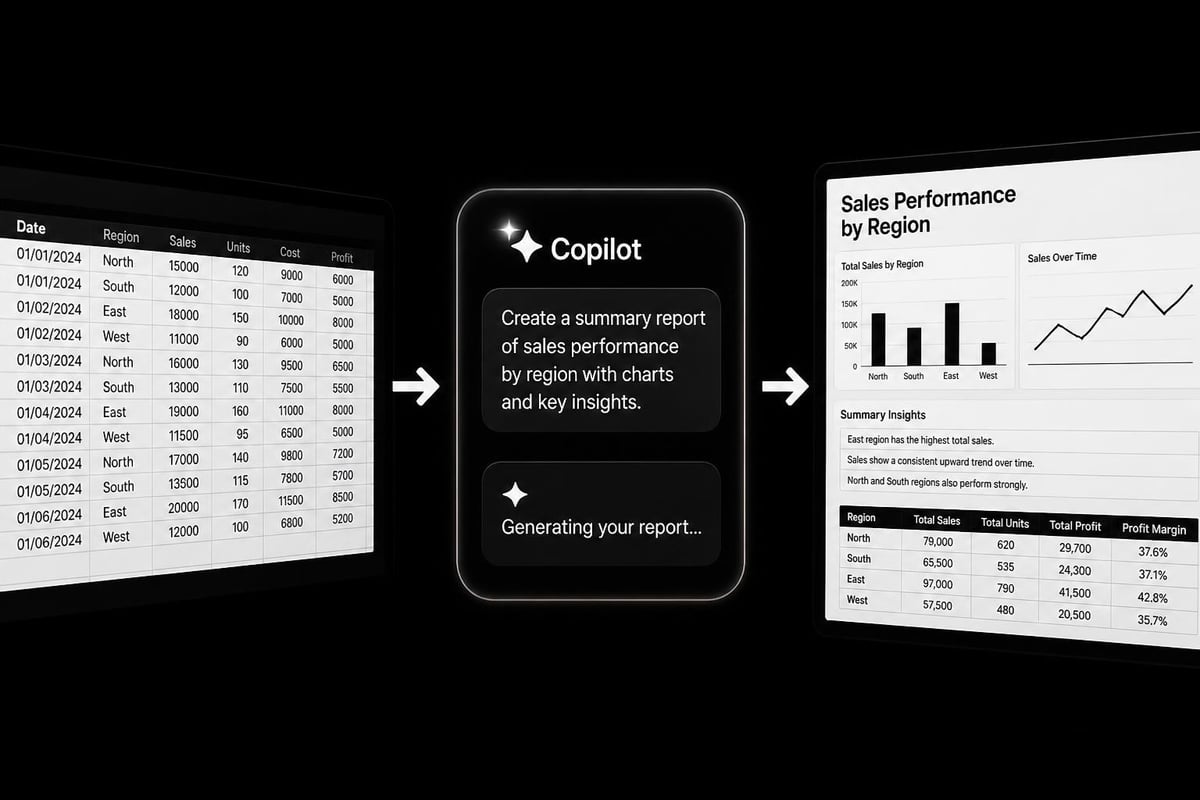
A comprehensive monthly report prompt might look like: "Create a monthly sales report that filters data for the current month, adds columns for margin percentage and year-over-year growth, creates a summary table by region, generates a column chart showing regional performance, and highlights any regions with negative growth in red."
Copilot processes this multi-part request and executes each step in logical order, creating a complete report package from a single instruction.
Effective Prompt Engineering
The quality of your automated outputs depends heavily on prompt clarity and specificity. Vague requests produce inconsistent results, while detailed, structured prompts generate reliable, repeatable workflows.
Prompt structure best practices:
- Start with the objective: "Create a weekly performance dashboard"
- Specify data scope: "using data from the SalesData table"
- Define calculations: "showing total revenue, average order value, and customer count"
- Request visualizations: "with a line chart of daily revenue trends"
- Include formatting: "and highlight any days below target in orange"
Creating Reusable Report Templates
Once you've developed effective automation prompts, converting them into reusable templates saves time across multiple reporting cycles. This approach works exceptionally well for weekly, monthly, or quarterly reports with consistent structure but changing data.
Template Design Strategy
Build your template workbook with separate sheets for raw data, calculations, and final output. The raw data sheet receives updated information each period, while calculation and output sheets contain formulas and Copilot-generated elements that reference the raw data.
When new data arrives, you simply replace the contents of the raw data sheet and refresh any Copilot elements that don't automatically update. For calculations that need regeneration, you can save your successful prompts in a separate documentation sheet within the workbook.
Version Control and Documentation
Maintain a log of which Copilot prompts successfully generated each report element. This documentation serves two purposes: it helps you recreate successful automations and provides troubleshooting reference if results change unexpectedly.
| Report Element | Copilot Prompt | Last Updated | Notes |
|---|---|---|---|
| Regional Summary | "Summarize total sales by region with month-over-month change" | June 2026 | Works best with table named RegionalData |
| Top Products Chart | "Create a bar chart showing top 10 products by revenue" | May 2026 | Requires ProductSales table |
| Trend Analysis | "Identify any products with declining sales over the last 3 months" | June 2026 | Sometimes needs clarification on threshold |
Visualization and Dashboard Automation
Static reports often require accompanying charts and dashboards for executive consumption. Copilot's data visualization capabilities streamline the creation of these visual elements through natural language commands.
Chart Generation Commands
Instead of manually selecting data ranges and choosing chart types, describe what you want to visualize. Prompts like "Create a stacked column chart comparing this year's and last year's monthly revenue" or "Show customer acquisition trends with a line chart" instruct Copilot to build appropriate visualizations.
The AI selects suitable chart types based on your data structure and requested comparison. For time-series data, it typically suggests line or area charts. For categorical comparisons, it recommends column or bar charts. You maintain final control, of course, and can request specific chart types if the automatic selection doesn't meet your needs.
Dynamic Formatting Rules
Conditional formatting helps reports highlight critical information without manual review. When you automate Excel reports with Copilot, include formatting instructions in your prompts: "Highlight any values below $10,000 in red and above $50,000 in green."
Copilot applies the formatting rules across your specified range, and these rules remain active for future data updates. This ensures consistent visual treatment across reporting periods without remembering manual formatting steps each time.
Handling Data Refresh and Updates
Automation loses value if you still need significant manual intervention each reporting cycle. Design your workflows to minimize touch points when new data arrives.
Connection to Data Sources
For organizations using Power Query or external database connections, configure your Excel workbook to refresh these connections automatically. When combined with Copilot automation, this creates end-to-end reporting workflows requiring only a refresh button click.
Your raw data updates from the source system, calculated columns regenerate with new values, and charts reflect current information. The only manual steps involve reviewing the output and distributing the report.
Error Handling and Validation
Even automated reports require validation checks. Include verification steps in your workflow to ensure data completeness and accuracy. Ask Copilot to "identify any blank values in required columns" or "check for duplicate transaction IDs" as part of your automation routine.
These validation prompts help catch data quality issues before they propagate into final reports, maintaining reliability even as you reduce manual processing time.

Comparing AI Tools for Excel Automation
While this article focuses on Copilot, other AI tools offer Excel automation capabilities. Understanding the differences helps you choose the right tool for specific scenarios.
The comparison between Claude vs Copilot for Excel reveals distinct advantages for each platform. Copilot's native integration provides seamless access within Excel's interface, while external AI tools like Claude offer more flexibility for complex logic and custom programming requirements.
Copilot advantages:
- Direct integration requiring no data export
- Real-time formula generation in cells
- Built-in understanding of Excel functions and features
- Automatic updates with Microsoft 365 subscription
Considerations and limitations:
- Requires Microsoft 365 subscription with Copilot license
- Performance varies with data complexity
- Limited customization compared to VBA macros
- Accuracy concerns for critical financial calculations
Microsoft itself has acknowledged that while Copilot provides powerful assistance, users should exercise caution when using it for tasks requiring absolute accuracy. Always review Copilot's outputs, especially for financial reporting or regulatory compliance scenarios.
Optimizing Performance for Large Datasets
As you automate Excel reports with Copilot using increasingly complex data, performance considerations become important. Large datasets or intricate formulas can slow Copilot's processing and response times.
Data Volume Best Practices
For reports processing hundreds of thousands of rows, consider pre-aggregating data before applying Copilot automation. Create a summary table with monthly or weekly totals rather than processing every individual transaction line.
This preprocessing reduces computational load while still enabling comprehensive reporting. You can maintain the detailed transaction data in a separate archive sheet or external database, pulling only summarized information into your active reporting workbook.
Formula Efficiency
When Copilot generates formulas, occasionally review them for efficiency. The AI sometimes creates functional but computationally expensive formulas that could be optimized. For recurring reports, investing time to streamline these formulas pays dividends in faster processing and file responsiveness.
Replace volatile functions like INDIRECT or OFFSET with structured references where possible. Use SUMIFS instead of array formulas when appropriate. These optimizations maintain automation benefits while improving workbook performance.
Integrating with Existing Workflows
Organizations rarely operate in isolation with single Excel files. Your automated reports likely need to integrate with broader business intelligence systems, email distribution lists, or dashboard platforms.
Export and Distribution Automation
While Copilot automates report generation within Excel, distribution often requires additional tools. Power Automate (formerly Microsoft Flow) can complement your Excel automation by enabling workflow triggers that email completed reports or save them to SharePoint locations on schedule.
This combination creates truly hands-off reporting: data refreshes automatically, Copilot generates analysis and visualizations, and Power Automate distributes the finished product to stakeholders-all without manual intervention beyond initial setup.
Integration with Business Intelligence Tools
For organizations using Power BI, Tableau, or similar platforms, Excel reports generated with Copilot can serve as data sources or validation references. The automated Excel output provides detailed backup for high-level dashboard metrics, giving analysts the ability to drill down into specifics when questions arise.
This two-tier approach balances accessibility (executives view dashboards) with depth (analysts access detailed Excel reports) while maintaining consistency through automation.
Training and Skill Development
Successfully implementing report automation requires understanding both Excel fundamentals and effective AI interaction. The learning curve varies based on existing Excel proficiency and comfort with conversational AI interfaces.
Learning Resources and Practice
Microsoft's official documentation provides the foundation, but hands-on practice with real data produces the fastest skill development. Start with simple automation tasks like generating a single calculated column or creating a basic chart before progressing to complex multi-step Agent Mode workflows.
The AI features for Excel overview explains available capabilities, while practical tutorials like this YouTube demonstration show real-world application. Combine these resources with experimentation on non-critical data to build confidence.
Building Organizational Capabilities
When introducing Copilot automation across teams, establish standards for prompt structure, template design, and documentation. This consistency ensures that reports remain maintainable even when personnel change, and it enables knowledge sharing across the organization.
Create a shared repository of successful prompts and templates that colleagues can reference. This library becomes increasingly valuable as your organization's automation sophistication grows.
Troubleshooting Common Issues
Even well-designed automation encounters occasional problems. Understanding common failure modes helps you quickly diagnose and resolve issues.
When Copilot Misinterprets Requests
If Copilot generates unexpected results, the issue often stems from ambiguous prompts or unclear data structure. Reformulate your request with more specific language, explicitly naming columns or ranges rather than using general terms.
For example, instead of "calculate the average," specify "calculate the average of the Revenue column for rows where Region equals 'West.'" This precision eliminates ambiguity and produces more reliable results.
Performance Degradation Over Time
Workbooks with extensive Copilot-generated content sometimes slow down with repeated use. This typically results from accumulating hidden data, unused named ranges, or inefficient formulas.
Periodically audit your workbook by removing unused sheets, clearing Copilot conversation history if available, and consolidating redundant calculations. For severely degraded files, rebuild the automation in a fresh workbook using your documented prompts.
Maintenance checklist for automated workbooks:
- Remove unused worksheets and data ranges monthly
- Review and optimize complex formulas quarterly
- Test automation with fresh data before critical reporting periods
- Document any prompt modifications or workarounds
- Backup working versions before major changes
Mastering these techniques to automate Excel reports with Copilot transforms time-consuming manual processes into efficient, repeatable workflows that free you to focus on analysis rather than data manipulation. Whether your formulas need optimization, your reporting process requires streamlining, or you're struggling with complex automation scenarios, The Analytics Doctor provides expert Excel help and personalized training that makes your spreadsheets work smarter. Get practical, hands-on support that solves your specific challenges and builds lasting Excel proficiency.