Struggling to keep your spreadsheet data organized and analysis-ready? In 2025, Excel tables are more powerful and essential than ever for anyone working with data.
This guide will help you master every aspect of the excel table, the cornerstone of modern data organization. Whether you are a beginner or an advanced user, you will discover how to boost productivity and accuracy in your daily workflows.
We will walk you through the basics of excel tables, offer step-by-step creation tips, explore advanced features, showcase real-world use cases, and share troubleshooting advice. Get ready to transform how you manage data in Excel.
Understanding Excel Tables: The Foundation of Modern Data Organization
Trying to get your data organized for analysis? The excel table is the backbone of modern spreadsheet organization. Whether you’re new to Excel or looking to level up, understanding how tables work can transform your workflow and reduce errors.
What Is an Excel Table?
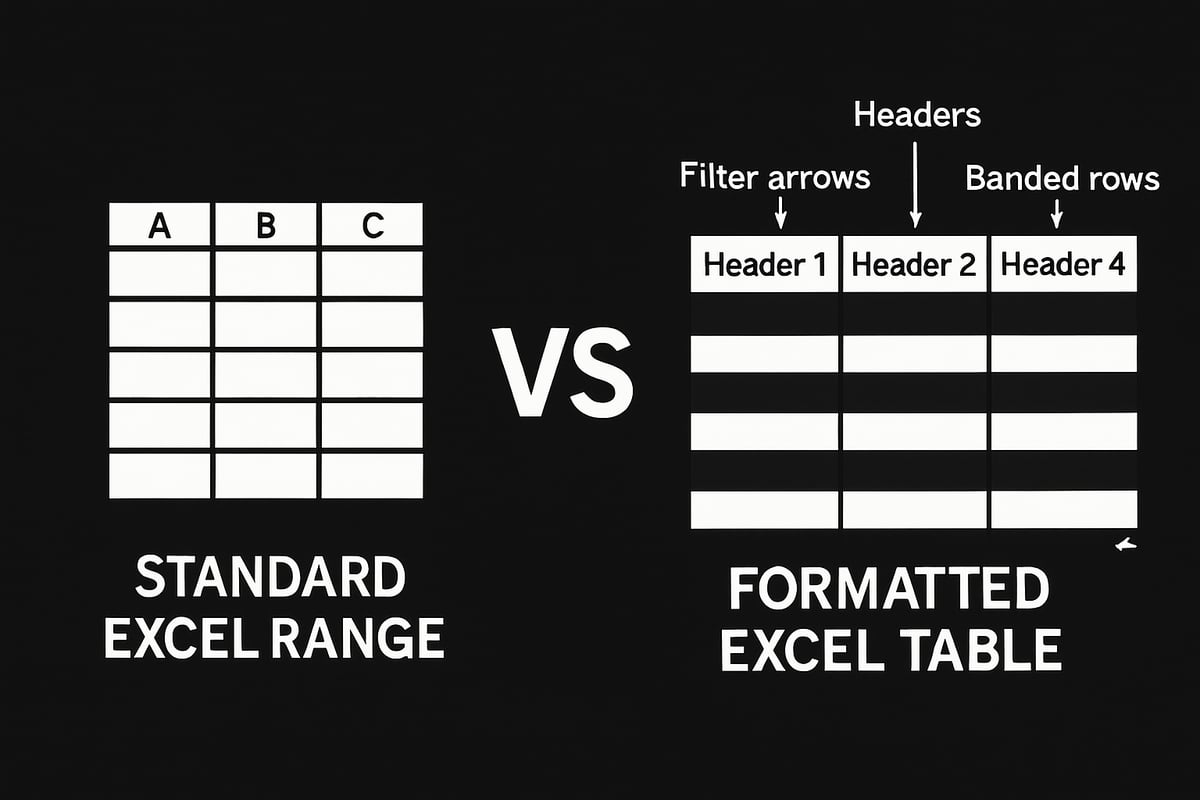
An excel table is a special feature introduced in Excel 2007 and available in all modern versions through 2025. Unlike a simple range of cells, an excel table has structured headers, automatic formatting, and a unique table name. This structure makes it easier to manage, analyze, and reference your data.
It’s important not to confuse an excel table with a data table used for What-If Analysis, which serves a different purpose. Key elements include:
- Header row with filter arrows
- Clearly defined columns and rows
- An assigned table name
| Standard Range | Excel Table | |
|---|---|---|
| Headers | Optional | Required |
| Formatting | Manual | Automatic |
| Expansion | Static | Dynamic |
Excel tables are now a standard in every version from 2010 through 2025. Visually, you’ll notice the difference right away—a formatted table stands out from a plain range.
Core Benefits of Using Excel Tables
Why should you use an excel table instead of a basic range? Here are some powerful advantages:
- Automatic banded rows for better readability
- Built-in filter and sort options in the header row
- Tables grow as you add new data, reducing manual updates
- Structured references make formulas easier and more reliable
For example, using an excel table means you don’t have to reapply formatting or fix formulas every time your list grows. This cuts down on errors and saves time. Want more reasons? Check out 5 Reasons to Use Excel Tables for a deep dive into the benefits.
Key Components of an Excel Table
Every excel table comes with components that make data management simple:
- Header row: Includes filter and sort buttons for each column
- Banded rows and columns: Improves clarity and visual appeal
- Calculated columns: Type a formula once, and it fills the entire column
- Total row: Instantly summarize data using SUM, AVERAGE, and more
- Sizing handle: Drag to resize the table easily
Imagine a table with all these features enabled—you can quickly analyze data without extra formatting or setup. Each element is designed to make working with data smoother and more efficient.
When and Why to Use Excel Tables
An excel table is ideal for many scenarios:
- Financial tracking and monthly budgets
- Sales reporting and CRM lists
- Project management and task tracking
- Inventory lists for small businesses
Using tables boosts data integrity and makes validation easier. Collaboration is also enhanced, as tables can be exported to SharePoint or shared with teams seamlessly. Microsoft and industry studies show that excel tables improve reliability and reduce errors in reporting. For instance, a small business tracking sales with an excel table experiences fewer mistakes and faster updates than with ordinary ranges.
Step-by-Step: Creating and Formatting Excel Tables in 2025
Ready to transform your spreadsheet workflow? Let’s break down how to create and format an excel table from scratch in 2025. Each step unlocks new ways to manage, analyze, and present your data with clarity and confidence.
Preparing Your Data for Table Conversion
Before you create an excel table, your data needs to be clean and well-organized. Start by ensuring your dataset is contiguous, with no blank rows or columns interrupting the flow. Headers should be clear, descriptive, and unique to avoid confusion later.
Remove unnecessary formatting or merged cells, as these can disrupt table features. If you’re unsure how to tidy up your spreadsheet, check out these best practices for cleaning and updating data to streamline your prep process.
For example, compare a cluttered range with blank spaces to a clean, ready-to-convert list. You’ll find that a well-prepared sheet is the foundation of a reliable excel table.
Methods to Create a Table in Excel
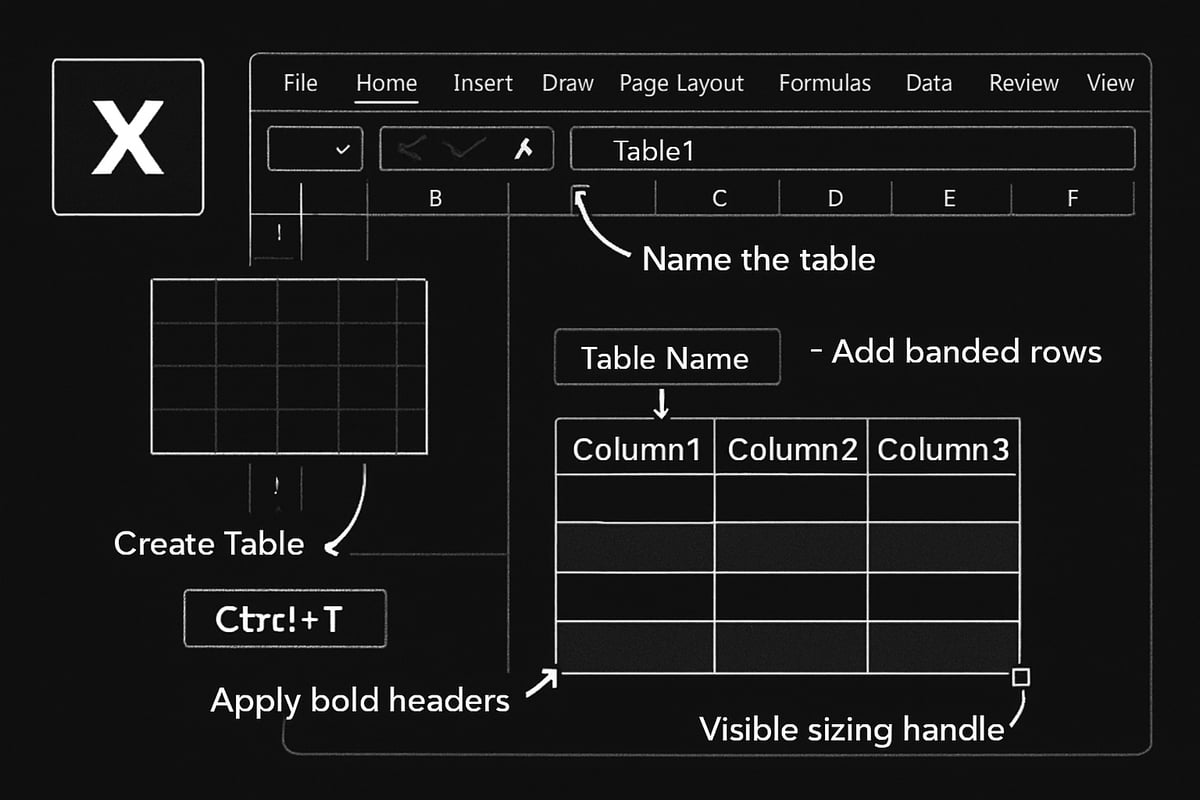
There are several ways to turn your data into an excel table. The quickest method is the keyboard shortcut:
Ctrl + T
This opens the "Create Table" dialog. Confirm that "My table has headers" is checked if you want your header row recognized.
Alternatively, use the ribbon:
- Home tab > Format as Table
- Insert tab > Table
Both paths let you pick a style and confirm your data selection. Screenshots or walkthroughs in Excel’s help center can guide you through each approach. Whichever you choose, your data instantly gains the benefits of an excel table.
Formatting and Customizing Table Styles
Once your excel table is created, it’s time to make it visually appealing and easy to read. Excel 2025 offers over 50 built-in table styles. Access these from the Table Design tab, where you can toggle between light, medium, and dark themes.
You can further customize:
- Banded rows for easier scanning
- Emphasize first or last columns for summaries
- Set a default style for all tables in the workbook
Try switching from the default blue to a custom color scheme for your brand. A well-formatted excel table not only looks professional but also improves data comprehension at a glance.
Naming, Resizing, and Moving Tables
Give your excel table a meaningful name for clarity, especially in workbooks with multiple tables. Go to Table Design > Table Name and enter something descriptive, like Sales_2025.
To add or remove rows and columns, drag the sizing handle at the table’s bottom-right corner. Moving a table is as simple as selecting and cutting/pasting it to a new location, either within the current sheet or to another.
Renaming “Table1” to something specific helps when referencing your excel table in formulas or charts, making your workflow smoother.
Removing or Converting Table Formatting
Sometimes, you may want to revert your excel table back to a normal range. Select the table, then go to Table Design > Tools > Convert to Range. This keeps your data intact but removes table-specific features and formatting.
You can strip the formatting while keeping formulas, though structured references will revert to standard cell references. For instance, converting a finished table to a range is common when archiving data or preparing static reports.
Knowing when and how to switch between table and range keeps your excel table management flexible and efficient.
Advanced Excel Table Features for Power Users
Unlock the full power of the excel table with advanced features designed to streamline data analysis and boost productivity. Whether you are managing sales data or building dashboards, these tools help you work smarter, not harder. Let’s dive into the essential capabilities every power user should know.
Integrated Sorting, Filtering, and Slicers
An excel table provides instant sorting and filtering through the filter arrows in the header row. Click these arrows to sort by value, filter by color, or apply custom criteria. For keyboard fans, pressing Ctrl+Shift+L toggles filter buttons on or off, making navigation even faster.
Add slicers to your excel table for a visual, intuitive way to filter data. Slicers, available in Excel 2013 and later, let you filter by categories like region or product with a single click. For example, you can quickly filter a sales table to show only results from the “West” region using a slicer. Slicers also make reports more interactive and clear.
Calculated Columns and Dynamic Formulas
With an excel table, calculated columns make formula management effortless. Enter a formula in one cell of a table column, and it automatically fills down for all rows. This means you can calculate profit margins or tax for every transaction without copying formulas manually.
Formulas in an excel table adapt as you add or remove rows, helping you avoid errors. You can enable or disable the “Fill formulas in tables to create calculated columns” option under Excel’s Advanced Options. For example, typing =[@Revenue]-[@Cost] in a “Profit” column instantly calculates profit for each row, updating as new data appears.
Total Row and Quick Summaries
The Total Row is a powerful feature of any excel table. Enable it from Table Design > Table Style Options, and a summary row appears at the bottom. Each cell in this row has a dropdown, letting you choose functions like SUM, AVERAGE, or COUNT for that column.
The Total Row uses the SUBTOTAL function, so calculations adjust based on visible rows after filtering. You can also enter your own custom formulas for deeper analysis. For instance, adding a Total Row to a sales table instantly shows total revenue, average transaction size, and count of sales, all updated live as you filter or add data.
Structured References: Making Formulas More Intuitive
Structured references are a game-changer for the excel table. Instead of using cell addresses like B2:B50, you write formulas referencing table and column names. For example, =SUM(Sales2025[Amount]) calculates the total of the “Amount” column in the “Sales2025” table.
Structured references make formulas easier to read and maintain, especially as your excel table grows. They automatically update if you rename columns or add new data. Use [@Column] for the current row, or TableName[Column] for the entire column. This approach reduces errors and keeps your formulas clear.
Automatic Table Expansion and Dynamic Charts
One standout feature of the excel table is automatic expansion. When you type in the row below or column beside a table, Excel extends the table to include new data. This is especially useful for ongoing projects or monthly reports.
Dynamic charts linked to an excel table update instantly as you add or remove data. For those building dashboards, this means your visuals always reflect the latest numbers. For a step-by-step guide on using tables for dynamic dashboard creation, check out Excel dashboard creation. This synergy between tables and charts saves time and ensures accuracy.
Data Validation and Ensuring Table Integrity
Data validation in an excel table keeps your information accurate and consistent. Apply validation rules to table columns, such as restricting entries to dates, numbers, or specific text lists. This prevents errors and maintains data quality across your spreadsheet.
You can also prevent duplicates in key fields, like customer IDs or product codes, by setting up validation. For example, use a dropdown list to restrict the “Status” column to values like “Open,” “Closed,” or “Pending.” These controls are essential for reliable reporting and analysis, especially in collaborative environments.
Printing, Sharing, and Exporting Tables
Printing an excel table is straightforward. Select the table, go to File > Print, and choose “Print Selected Table” to print only the relevant data. This avoids wasting paper on empty rows or unrelated content.
Share your excel table with colleagues via OneDrive or Teams for real-time collaboration. You can also export tables to SharePoint, making it easy for teams to edit and update data together. For example, exporting a table to SharePoint allows multiple users to work on the same data set, keeping everyone aligned and up-to-date.
Managing and Optimizing Table Data
Keeping your excel table data well managed is the secret to unlocking productivity and accuracy. Whether you are updating inventory, tracking sales, or analyzing trends, strong data management ensures your tables remain reliable and easy to use. Let us explore the essential steps for maintaining and optimizing your excel table data for any scenario.
Adding, Deleting, and Rearranging Rows/Columns
Adding new data to your excel table is as simple as typing in the row directly below your existing data or to the right for a new column. Excel table ranges automatically expand, making updates seamless. To insert or delete rows and columns, use the right-click menu or the Home tab’s Cells group. The Tab key also adds a new row if the Total Row is off.
Example steps:
- Right-click a row number or column letter inside your excel table.
- Choose Insert or Delete.
- Use Tab in the last cell to add a new row.
Need to rearrange? Just select the entire row or column and drag to a new location within the table. This keeps your data organized and your formulas intact.
Selecting, Copying, and Moving Table Data Efficiently
Working with large data sets in an excel table means you need efficient ways to select and move information. Use Ctrl+Space to select a column or Shift+Space for a row. To copy a column, select its header, press Ctrl+C, then paste where needed.
When moving data between tables or sheets, avoid overwriting existing data by using drag-and-drop or the Cut (Ctrl+X) and Paste (Ctrl+V) commands. For advanced database-like moves, explore Excel database techniques to enhance your workflow.
Duplicating a column, such as “Q1 Sales,” for “Q2 Sales” is just a copy-paste away, keeping your excel table structure consistent.
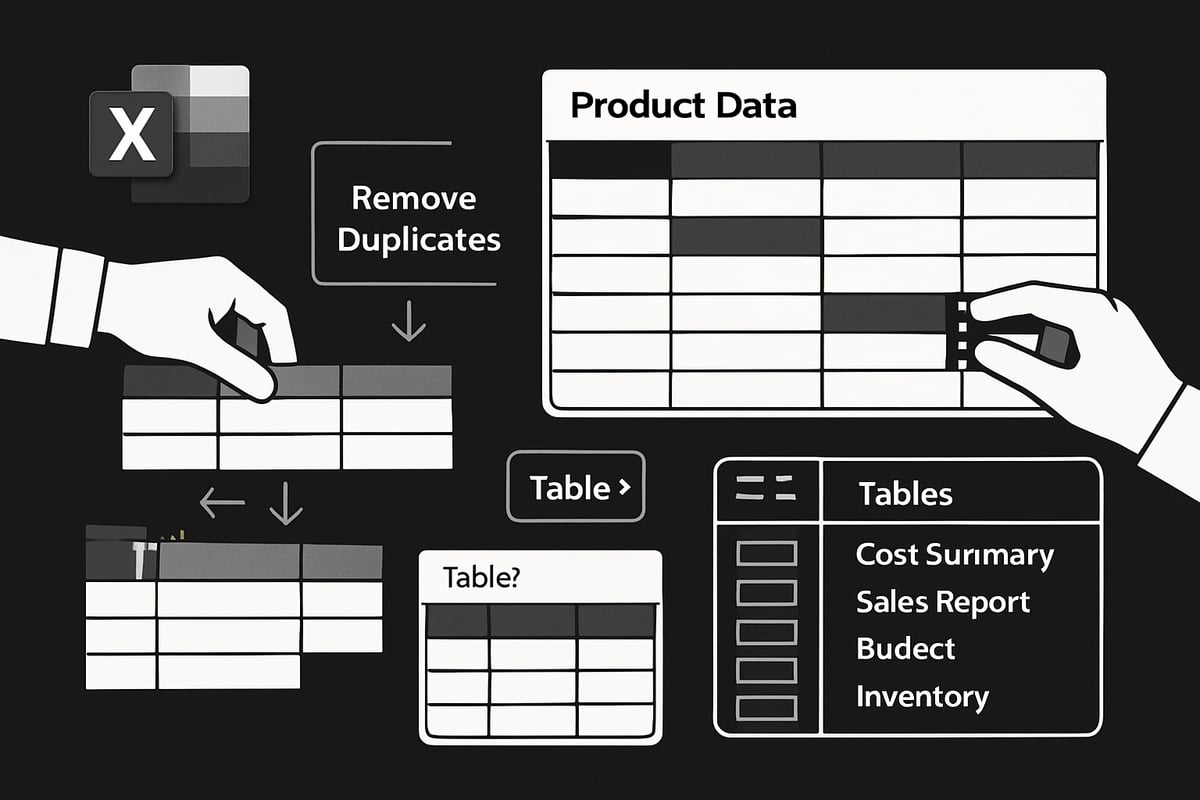
Removing Duplicates and Cleaning Table Data
Duplicates can skew your analysis, so keeping your excel table clean is vital. Select your table, go to Table Design, and click Remove Duplicates. Choose which columns to check, and Excel will instantly highlight and clear repeats.
Other cleanup tips:
- Use Data Validation to ensure consistent entries.
- Regularly review for empty cells or errors.
- Apply filters to spot inconsistencies.
For example, if you have a customer list, removing duplicate email addresses ensures your reports reflect accurate, unique contacts. Industry standards show that clean excel table data leads to more reliable business insights.
Converting Tables to Ranges and Vice Versa
Sometimes, your excel table needs to become a static range for archiving or special formatting. To convert, select the table, go to Table Design, and choose Convert to Range. This removes table features but keeps your data.
Note: Structured references will revert to standard cell references, so check your formulas.
To make a range a table again, select your data and hit Ctrl+T. This is helpful when you want to reactivate table features for analysis. For example, archiving last year’s data as a range keeps your current excel table clean and focused.
Renaming and Managing Multiple Tables in a Workbook
Naming your excel table with a clear, descriptive name makes it easier to reference in formulas and manage multiple tables. Go to Table Design and change the Table Name from the default (like “Table1”) to something meaningful, such as “Expenses2025.”
For workbooks with many tables:
- Use consistent naming conventions.
- Organize tables logically on separate sheets.
- Use Name Manager (Formulas tab) to see all table names at a glance.
For example, naming tables “Revenue2025,” “Inventory2025,” and “Expenses2025” keeps your workbook organized and your data easy to find.
Real-World Use Cases and Best Practices for Excel Tables
Keeping your data organized is essential for any business, and the excel table is a powerful tool that adapts to countless real-world scenarios. Let’s explore how professionals use tables every day and discover the best ways to get the most out of them.
Common Business Applications for Excel Tables
The excel table shines in a variety of business contexts. Financial teams use tables for budgets and forecasts, while sales departments rely on them for tracking leads and analyzing performance. Inventory managers list products, monitor stock, and automate reordering tasks. Project teams organize tasks, timelines, and deliverables, making collaboration seamless.
- Budgets and expense tracking
- Sales analysis and CRM pipelines
- Inventory and supply chain lists
- Project management and scheduling
For example, a monthly expense tracker built as an excel table enables quick sorting, filtering, and error-free calculations. Discover even more benefits in Ten Reasons to Use Tables in Excel.
Best Practices for Table Design and Maintenance
A well-structured excel table starts with clear, descriptive headers. Avoid blank rows or columns inside the table, as these can break formulas and disrupt sorting. Regularly validate data to catch errors early, and stick to consistent formatting and naming conventions for clarity.
- Use meaningful column names
- Keep data contiguous without empty cells
- Review and clean data monthly
- Apply uniform styles for readability
A simple monthly checklist can help keep your excel table reliable and ready for analysis at any time.
Optimizing Performance with Large Data Sets
Working with a large excel table demands a few optimization strategies. Excel 2025 supports massive tables, but performance may lag if too many volatile formulas or excessive formatting are used. Keep formulas efficient, limit conditional formatting, and use filters or summary rows instead of full-table calculations.
- Minimize use of resource-heavy functions
- Filter and sort in smaller batches
- Archive old data when possible
For instance, a table with over 50,000 rows can still run smoothly if you keep calculations simple and focus on essential data only.
Troubleshooting Common Table Issues
Even the most organized excel table can encounter issues. Broken formulas often result from renamed columns or table resizing. Formatting glitches may appear after copy-paste actions, and sometimes references break after structural changes.
- Double-check column references after edits
- Use Undo to recover from accidental deletions
- Reapply table styles if formatting is lost
When data gets deleted by mistake, Excel’s version history and Undo feature are your best friends for quick recovery. For collaborative environments, see Excel Tables: Organizing Data Effectively for tips on managing shared tables.
Excel Table Automation and Integration in 2025
Keeping up with data demands in 2025 means harnessing every advantage the excel table offers. Automation, integration, and collaboration are no longer optional—they are the backbone of efficient workflows. Here is how you can make every excel table work harder for you, from smart formulas to seamless cloud sharing.
Automating Workflows with Table-Driven Formulas
An excel table streamlines automation by enabling structured references and dynamic formulas. Instead of cell-based formulas, you use intuitive names like =Sales2025[Amount], which automatically adjust as data grows.
- Structured references apply formulas to entire columns instantly.
- Dynamic arrays and spill formulas (available in Excel 365/2025) let you pull live results without manual updates.
- Automation tools, such as Power Automate, can trigger workflows based on table changes.
For a deeper dive into automation and dynamic features, check out The Power of Excel Tables: Organizing Your Data Effectively. Imagine updating a dashboard where every chart and summary refreshes automatically as soon as new data lands in your excel table.
Integrating Tables with Power Query and Power BI
Seamless integration is a hallmark of the modern excel table. With Power Query, you can transform and clean data directly from your table, making complex manipulations easy.
- Load table data into Power Query for filtering, merging, and shaping.
- Connect excel table data to Power BI for real-time dashboards and advanced visualization.
- Refresh connections with one click, keeping reports up to date.
Picture linking your sales excel table to a Power BI dashboard. As sales reps enter new deals, your visuals and KPIs update instantly, giving everyone the latest insights.
Collaborative Features: Sharing, Co-Authoring, and Security
Collaboration is now effortless with an excel table. Share your workbook via OneDrive or Teams, and multiple people can edit the same table in real-time.
- Co-authoring lets users see changes as they happen.
- Table-level protection secures sensitive columns or rows.
- Track changes and comments for better team communication.
Security is stronger, too. Permissions can be set on the excel table, allowing only authorized team members to edit critical data. This ensures integrity and accountability in collaborative environments.
Future-Proofing Your Excel Tables
Adapting to new technology is easier when your excel table is built for the future. Microsoft continues to add features, so tables created in 2025 are compatible with cloud and desktop apps.
- Use standard table structures for easy migration between versions.
- Test tables in both Excel for web and desktop to ensure smooth workflow.
- Stay updated on new features to maximize productivity and avoid compatibility issues.
A well-structured excel table is your ticket to reliable, efficient data management, no matter how the platform evolves.