In 2026, data-driven decisions are redefining how businesses compete and grow. Excel remains the backbone for data analysis across industries, evolving with smarter features each year.
Mastering data analysis in Excel unlocks productivity, reveals actionable insights, and streamlines reporting. For professionals aiming to stay ahead, these skills are more valuable than ever.
This guide will show you exactly how to add data analysis in Excel, from enabling essential tools to applying advanced techniques. You will learn how to set up the Data Analysis ToolPak, use key features, troubleshoot common issues, and adopt best practices for 2026.
Understanding Data Analysis in Excel
Data analysis in Excel has become the backbone of decision-making for organizations worldwide. As businesses generate more data than ever before, Excel continues to adapt, offering advanced tools and automation to meet modern analytical needs. In 2026, learning how to add data analysis in Excel means unlocking powerful insights, streamlining processes, and staying competitive in a rapidly evolving landscape.

What Is Data Analysis in Excel?
Data analysis in Excel refers to the process of examining, cleaning, transforming, and modeling data to discover useful information, draw conclusions, and support decision-making. Over the years, Excel has evolved from a simple spreadsheet tool to a robust analytics platform. Today, it supports multiple types of analysis, including descriptive, diagnostic, predictive, and prescriptive methods. With Excel 2026, AI and automation are deeply integrated, allowing users to perform tasks like trend analysis, forecasting, and scenario modeling more efficiently.
| Type | Purpose | Example Use |
|---|---|---|
| Descriptive | Summarize past data | Sales trends |
| Diagnostic | Understand causes | Error analysis |
| Predictive | Forecast future outcomes | Demand planning |
| Prescriptive | Suggest actions | Scenario modeling |
Knowing how to add data analysis in Excel empowers professionals to handle everything from basic summaries to advanced forecasting, all within a familiar environment.
Why Excel Remains Essential for Data Analysis in 2026
According to Gartner (2025), over 80% of businesses continue to depend on Excel for core data tasks. While platforms like Power BI and Tableau offer robust analytics capabilities, Excel stands out for its accessibility, flexibility, and deep integration with cloud and collaborative tools. In 2026, Excel users benefit from significant improvements, such as enhanced Power Query performance and AI-driven features for instant insights.
Compared to other analytics solutions, Excel requires minimal setup and offers a gentle learning curve. Anyone interested in how to add data analysis in Excel will appreciate its seamless compatibility with Office 365, real-time collaboration, and frequent updates tailored to user needs. For a comprehensive overview, see this guide on data analysis in Microsoft Excel, which details the platform’s evolving capabilities.
Key Data Analysis Features in Excel
Excel 2026 includes an impressive array of built-in tools for data analysis. Some of the most important features are:
- Data Analysis ToolPak for advanced statistical analysis
- Power Query for data import and transformation
- PivotTables for dynamic data summarization
- Charts for visualizing trends and patterns
The new Excel release introduces improved automation, AI-powered insights, and expanded integration with third-party add-ins. These advancements make it easier for users to learn how to add data analysis in Excel and customize their workflows for financial modeling, market analysis, and more. Add-ins and integrations further extend Excel’s analytical power, enabling specialized solutions for any industry.
Common Use Cases and Benefits
A wide range of industries and professionals rely on Excel for data analysis. Finance, operations, and education are just a few sectors where mastering how to add data analysis in Excel leads to tangible results. Common scenarios include sales forecasting, budget planning, and inventory management, each benefiting from Excel’s speed and accuracy.
- Finance: Budget planning, investment analysis
- Operations: Inventory tracking, workflow optimization
- Education: Student performance analysis, resource allocation
Using Excel for data analysis not only saves time but also reduces errors. User surveys consistently report improved productivity and confidence in decision-making when leveraging Excel’s analytical tools.
Preparing Your Data for Analysis
Preparing your data is the foundation of effective analysis in Excel. Clean, structured, and validated data ensures that the insights you uncover are accurate and actionable. Whether you are a beginner or an experienced professional, understanding how to add data analysis in excel starts with mastering data preparation.
Importance of Clean Data
Clean data is the backbone of any successful analysis. If you want to learn how to add data analysis in excel, you must first address data quality. Inaccurate or inconsistent data leads to misleading results, wasted time, and poor business decisions.
Common data issues include duplicate entries, missing values, and inconsistent formats. According to IBM, data errors can reduce productivity by up to 30 percent. Taking time to address these problems before analysis is not just best practice, it is essential for reliability.
By focusing on clean data, you set yourself up for accurate insights and efficient workflows. This step is vital for anyone looking to master how to add data analysis in excel.
Step-by-Step Data Preparation Process
To start, import your data into Excel from sources like CSV files, databases, or cloud platforms. Excel 2026 streamlines this process, allowing direct imports and seamless integration with cloud storage.
Begin cleaning your data by removing duplicates, using the Find and Replace tool to fix errors, and trimming extra spaces from cells. These steps are crucial when learning how to add data analysis in excel. Excel 2026 introduces improved Power Query tools, making it easier to transform and shape your data before analysis.
Always review your data after cleaning, ensuring it is consistent and ready for the next stage. A well-prepared dataset saves time and reduces the risk of analysis errors.
Structuring Data for Analysis
Proper structure is key when preparing data for analysis. Start by organizing your data into Excel tables with clear headers and named ranges. Avoid merged cells, as they can disrupt formulas and analysis tools.
Normalization, or ensuring each column contains a single type of information, helps maintain consistency. For example, a sales dataset should have separate columns for date, product, and sales amount.
A well-structured dataset not only improves readability but also enhances efficiency when you are ready to learn how to add data analysis in excel. This organization supports advanced tools like PivotTables and Power Query.
Data Validation and Error Checking
Data validation is essential for preventing input errors and maintaining data integrity. Excel’s Data Validation tools allow you to set rules for what can be entered in each cell, reducing the risk of mistakes.
Conditional formatting helps highlight errors or outliers automatically. In Excel 2026, AI-powered error detection flags potential issues as you work, making quality control even easier. For a comprehensive checklist of techniques, explore Data validation rules in Excel to strengthen your data preparation process.
Maintain data quality with regular checks and updates. Consistent validation ensures your analysis remains accurate and reliable.
Enabling and Accessing the Data Analysis ToolPak
Unlocking advanced analytics starts with understanding the Data Analysis ToolPak in Excel. This powerful add-in brings sophisticated statistical and data analysis capabilities directly to your spreadsheets. Learning how to add data analysis in excel ensures you maximize these features to drive smarter business decisions.
What Is the Data Analysis ToolPak?
The Data Analysis ToolPak is a built-in Excel add-in that empowers users to perform complex statistical analyses without external software. With this tool, you can run regression, ANOVA, descriptive statistics, and more, all within your workbook.
In Excel 2026, the ToolPak has received significant updates, including a refreshed interface, enhanced performance, and new statistical functions. These improvements are part of the broader push for smarter analytics—see New Excel Features in 2026 for a complete overview. Knowing how to add data analysis in excel allows you to leverage these capabilities for deeper insights.
How to Install/Enable the ToolPak in Excel 2026
Enabling the ToolPak is straightforward in Excel 2026. Start by clicking File, then select Options, and navigate to the Add-ins tab. Next, choose Excel Add-ins from the Manage dropdown and click Go. In the list, check Analysis ToolPak and confirm with OK.
If you are using Office 365, the ToolPak is typically pre-installed, so you may only need to activate it. Following these steps ensures you know how to add data analysis in excel on both Windows and Mac. For users experiencing issues, double-check your subscription or consult your IT administrator.
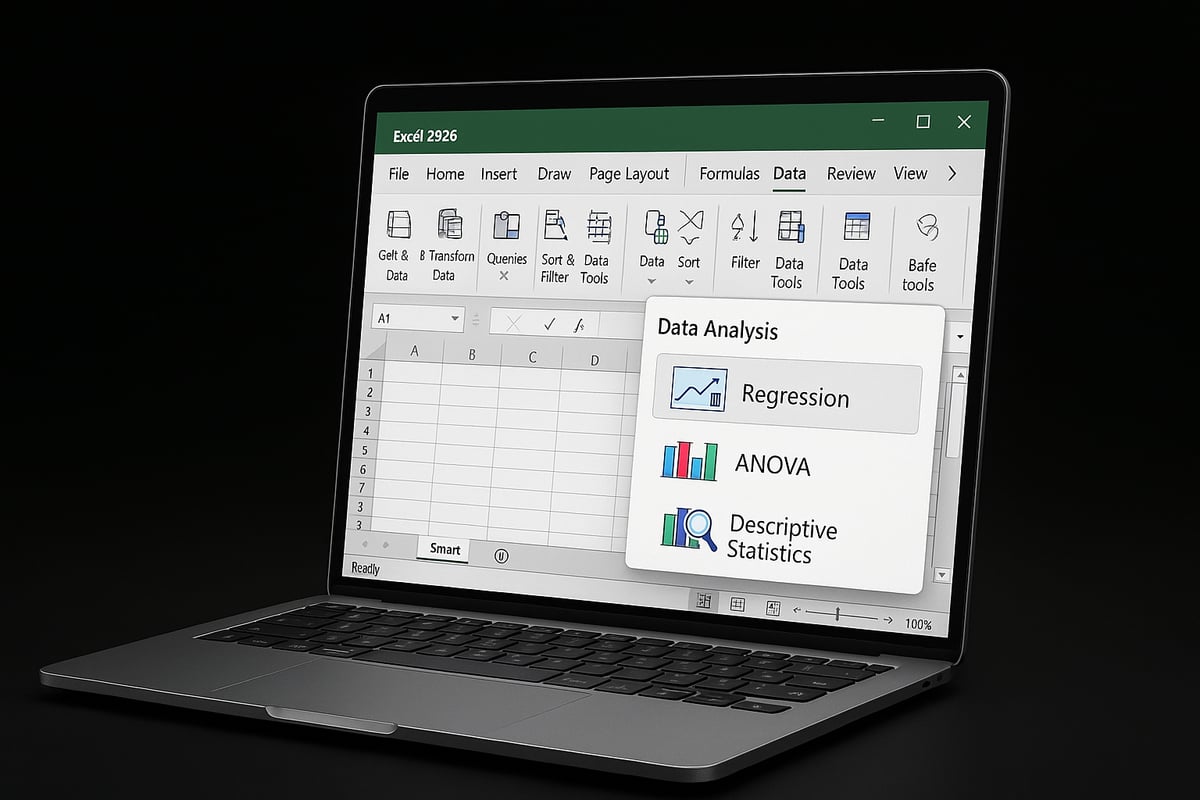
Navigating the Data Analysis Tools
After enabling the ToolPak, a new Data Analysis button appears under the Data tab. Clicking this button reveals a menu of statistical tools, such as regression, t-tests, and correlation analysis. Select the desired analysis, fill in the input range fields, and configure output options as needed.
Excel 2026 introduces a cleaner interface and improved tooltips, making it easier to understand each analysis type. Mastering how to add data analysis in excel means you can quickly launch the right tool for your project, saving valuable time and minimizing errors.
Troubleshooting ToolPak Issues
Common issues include the ToolPak not appearing, options being greyed out, or compatibility errors between Mac and Windows. If the add-in is missing, revisit the Add-ins menu to ensure it is checked. For greyed-out features, confirm your data is correctly formatted and that you have the necessary permissions.
Corporate environments may have IT restrictions that block add-ins, so coordinate with your administrator if needed. For persistent problems, consult Microsoft’s official support or community forums. By resolving these issues, you maintain seamless access and continue to benefit from how to add data analysis in excel.
Essential Data Analysis Techniques in Excel
Unlocking the full potential of your data in Excel begins with mastering essential analysis techniques. Whether you are new or experienced, knowing how to add data analysis in excel empowers you to extract insights, automate tasks, and make informed decisions. Below, we break down the core tools and approaches you need to succeed in 2026.
Descriptive Statistics and Summarization
Understanding how to add data analysis in excel starts with descriptive statistics. Excel’s Data Analysis ToolPak lets you quickly calculate mean, median, mode, and standard deviation. For instance, analyzing sales data across months helps you identify trends and outliers.
Here is a sample summary table:
| Statistic | Value |
|---|---|
| Mean Sales | $12,500 |
| Median Sales | $11,800 |
| Std. Deviation | $2,100 |
Visualizing these metrics with charts offers a clearer picture. Use bar or column charts to highlight key figures and spot anomalies at a glance.
Regression Analysis and Forecasting
Regression analysis is vital when learning how to add data analysis in excel for predictive modeling. With Excel’s regression tool, you can establish relationships between variables, such as sales and advertising spend.
To run a linear regression, navigate to the Data Analysis ToolPak, select Regression, input your data ranges, and interpret the output, focusing on R² and p-values. Accurate forecasting enables better resource allocation and planning for future scenarios.
Hypothesis Testing (t-Tests, ANOVA)
Applying hypothesis testing is another core aspect of how to add data analysis in excel. Excel provides t-tests and ANOVA tools to compare groups and validate assumptions.
For example, you might compare the performance of two sales teams using a t-test. Select the appropriate test in the ToolPak, enter your data, and analyze the significance level. These techniques are essential for evidence-based decision-making in business settings.
Data Visualization: Charts and PivotTables
Effective visualization is key to understanding and communicating results. When considering how to add data analysis in excel, PivotTables and charts stand out as versatile tools. PivotTables allow you to summarize large datasets, filter information, and create interactive reports.
For a comprehensive guide, see How to make Excel PivotTable. Combine PivotTables with line, bar, or scatter charts to reveal patterns and trends, making your findings accessible to stakeholders.
Using Power Query for Advanced Transformations
Advanced users exploring how to add data analysis in excel benefit from Power Query. This tool automates data import, cleansing, and transformation tasks. With Power Query, you can merge multiple sources, reshape tables, and remove duplicates with just a few clicks.
For example, you might combine sales reports from various regions into one unified dataset. Power Query streamlines this process, saving time and reducing manual errors.
Leveraging AI and Automation in Excel 2026
Excel 2026 introduces cutting-edge AI and automation features, further enhancing how to add data analysis in excel. The “Analyze Data” tool leverages machine learning to surface trends and suggest insights instantly.
You can automate reports using macros or scripts, freeing up valuable time. These advancements make it easier than ever to turn raw data into actionable intelligence, supporting faster and smarter business decisions.
Advanced Tips, Best Practices, and Resources
Staying ahead with how to add data analysis in excel means adopting proven strategies, avoiding common mistakes, and leveraging the latest resources. This section delivers actionable tips, collaborative techniques, and learning pathways to help you achieve mastery in Excel data analysis.
Best Practices for Efficient Data Analysis
To excel in how to add data analysis in excel, structure your workbooks clearly. Use separate worksheets for raw data, calculations, and results. Maintain consistent naming conventions, document your steps, and implement version control to track changes. Templates and reusable models streamline routine tasks, boosting efficiency.
Consider integrating advanced tools like Power Pivot Overview for complex modeling. This feature supports robust data analysis and improves overall workflow. Organized workbooks reduce errors and help teams collaborate more effectively.
Common Pitfalls and How to Avoid Them
Even skilled users encounter mistakes when learning how to add data analysis in excel. Common errors include incorrect formulas, referencing the wrong cells, or misinterpreting outputs. To minimize risks, always double-check calculations and validate assumptions.
According to the University of Hawaii, up to 88% of spreadsheets contain errors. Establish a checklist for review, use cell protection, and leverage Excel’s auditing tools. Familiarize yourself with Power Pivot for advanced data modeling, which can help prevent structural issues in large datasets.
Collaboration and Sharing in Excel 2026
Modern teams rely on real-time collaboration to maximize how to add data analysis in excel. Excel 2026 integrates seamlessly with OneDrive and Teams, enabling multiple users to co-author and comment on files simultaneously.
Manage permissions carefully to protect sensitive data. Use cloud-based sharing for version control and backup. Real-time editing reduces bottlenecks and ensures everyone works from the latest dataset, improving productivity and data integrity.
Keeping Up with New Features and Updates
Excel evolves rapidly, so staying current is essential if you want to master how to add data analysis in excel. Join Microsoft’s Insider Program to preview upcoming features and test beta tools. Follow official blogs and reputable forums to stay informed about updates and best practices.
Explore new AI-powered analytics like Excel’s AI-Powered Copilot Enhancements, which offer deeper insights and automate complex tasks. Continuous learning ensures you leverage every advancement Excel offers.
Expert Help and Training from The Analytics Doctor
If you need expert guidance on how to add data analysis in excel, The Analytics Doctor provides tailored solutions. Services include personalized training, troubleshooting, automation, and advanced consulting for individuals or corporate teams.

Benefit from hands-on workshops, custom programming, and resource-rich support. Whether you are a beginner or a seasoned analyst, The Analytics Doctor can help you solve complex Excel challenges and advance your data skills.
Further Learning and Certification Options
Continuous development is key to mastering how to add data analysis in excel. Consider earning certifications such as Microsoft Certified: Data Analyst Associate to validate your skills. Explore online platforms offering advanced Excel courses, from foundational topics to specialized analytics.
Engage in community forums and peer groups for ongoing support. Staying committed to learning will keep you competitive and open doors to new career opportunities in data analysis.
Troubleshooting and Frequently Asked Questions
When working through how to add data analysis in excel, even experienced users encounter challenges. Knowing how to resolve common issues can save time and ensure accurate results. Below, you will find troubleshooting tips and answers to frequently asked questions to help you master how to add data analysis in excel.
Common Data Analysis Errors in Excel
Mistakes can occur even when you know how to add data analysis in excel. Formula errors, incorrect cell references, and data type mismatches are frequent culprits. For example, using relative instead of absolute references may cause formulas to break when copied.
To avoid these issues:
- Double-check all formulas and functions for accuracy.
- Use
=ISERROR()or=IFERROR()to catch potential problems. - Regularly validate data types and formats, especially after importing.
For step-by-step guidance on a popular analysis such as moving averages, see this How to calculate moving average Excel tutorial. Understanding these basics ensures your data analysis remains reliable.
Fixing Analysis ToolPak and Add-in Problems
If you are struggling with how to add data analysis in excel because the ToolPak is missing or not working, start by checking the Add-ins menu under File > Options > Add-ins. Sometimes, the ToolPak appears greyed out due to version incompatibility or admin restrictions.
Troubleshooting steps:
- Ensure you have the latest version of Excel 2026.
- Restart Excel after enabling the ToolPak.
- On Macs, verify that add-ins are supported for your subscription.
- If corporate IT blocks add-ins, consult your administrator for access.
If issues persist, visit official Microsoft support forums or community pages for further assistance. Staying proactive with updates helps prevent these common stumbling blocks.
Data Security and Privacy Considerations
Learning how to add data analysis in excel is not just about tools; it is also about keeping your data safe. Use password protection for sensitive workbooks and enable encryption for confidential files.
Additional best practices:
- Store files in secure cloud environments like OneDrive.
- Limit access to authorized users with permission settings.
- Comply with regulations such as GDPR or CCPA by anonymizing personal data where possible.
Always review your organization's data policies before sharing or collaborating on analysis files. Taking these steps will help you work confidently and securely.
FAQs: Quick Answers to Top User Questions
How much data can Excel handle for analysis in 2026?
Excel 2026 supports millions of rows per worksheet, but performance depends on your system's memory and file complexity.
Can Excel replace dedicated analytics software?
While Excel offers robust features and is ideal for most business needs, specialized platforms may be required for advanced modeling.
What are the limitations of the ToolPak?
The ToolPak focuses on core statistical methods. Some advanced analyses may require add-ins or custom scripts.
How to automate repetitive analysis tasks?
Use macros, Power Query, or built-in AI features to streamline workflows. For more advanced automation, consider learning VBA or connecting to Power Automate.
If you have more questions about how to add data analysis in excel, explore tutorials and expert forums for targeted help.