Imagine turning complex numbers into vibrant visuals that instantly capture attention. A balloon graph makes data not only clear but also memorable, creating a fresh way to communicate insights in 2026.
This guide will empower you to harness the unique strengths of balloon graphs for creative data visualization. You will learn how to transform ordinary information into engaging stories that resonate with your audience.
Inside, you will discover what balloon graphs are, their key benefits, step-by-step creation methods, inspiring real-world examples, and advanced customization strategies. Ready to elevate your data presentations? Let’s get started.
What Is a Balloon Graph?
Balloon graphs are transforming the way we present complex data, offering a visually engaging alternative to standard charts. They stand out by using balloon-shaped markers to represent data points, making patterns and relationships more approachable for any audience.

Definition and Core Features of Balloon Graphs
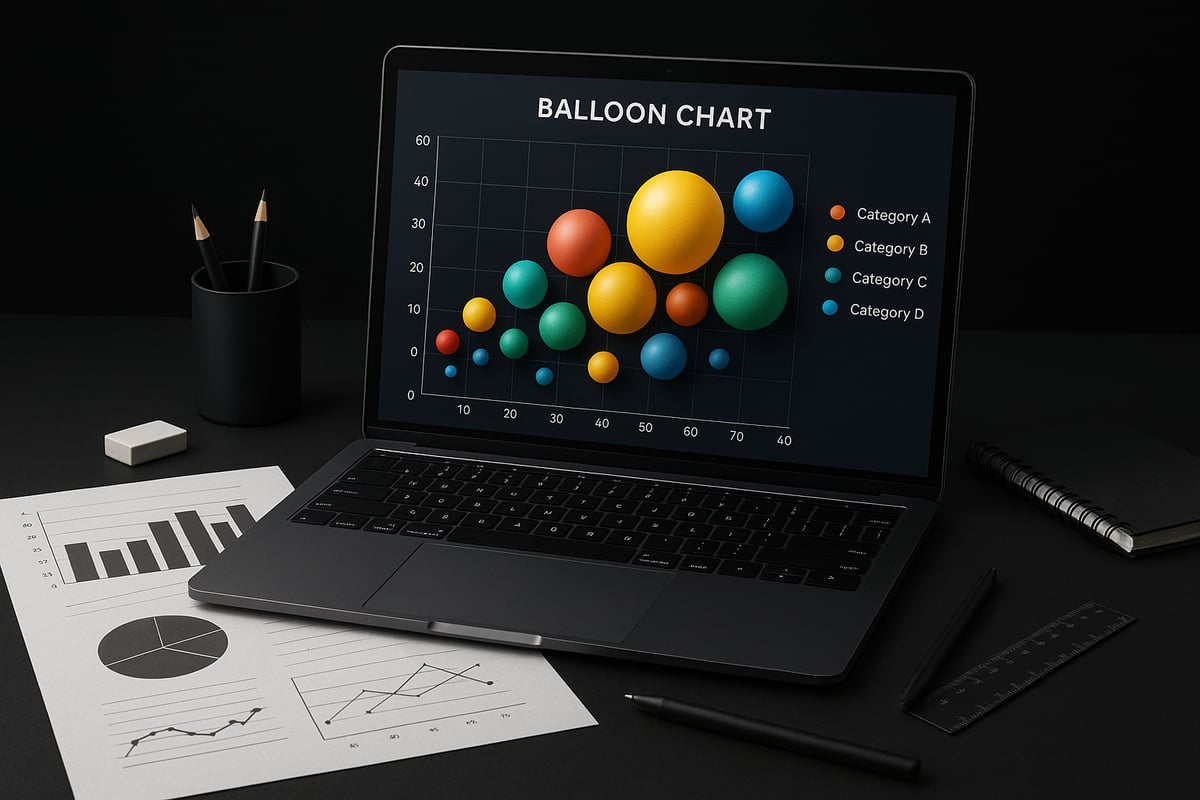
A balloon graph is a data visualization tool where each data point is represented as a floating balloon. Unlike bar, line, or pie charts, the balloon graph uses the size, color, and position of each balloon to encode multiple variables at once. For example, the size might indicate quantity, color could represent a category, and position shows value or ranking.
This method allows viewers to quickly compare several dimensions in a single glance. The playful, intuitive design appeals to both technical and non-technical audiences. Balloon graphs excel at comparing quantities, illustrating distributions, and revealing relationships that might be missed in traditional charts.
Core visual elements include:
- Balloons as data markers
- Variable sizes proportional to a value
- Color coding for categories or segments
- Spatial arrangement to show trends or clusters
A balloon graph is often compared to a bubble chart, but the terms are sometimes used interchangeably. Technically, a bubble chart is a scatter plot with variable point sizes, while a balloon graph can be more flexible in representing categorical or hierarchical data. For a deeper dive into the design and impact of balloon-like data visualizations, see SkyGlyphs: Design of a Delightful Visualization.
Common use cases include comparing market shares, student scores, or survey results, especially where more than two variables need to be visualized at once.
History and Evolution in Data Visualization
The balloon graph has roots in early data visualization experiments, evolving as designers sought new ways to make data more visually compelling. While bar and line charts have dominated business and academic reporting, the balloon graph gained traction as software capabilities expanded.
With the advent of user-friendly tools like Excel and Google Sheets, balloon graphs became easier to create and customize. Businesses began using them for dashboards and presentations, while educators adopted them for classroom activities and worksheets.
By 2026, balloon graphs are widely featured in both digital and printed reports. Their adoption in classrooms has grown, as teachers seek creative ways to introduce students to multivariable analysis. Corporate teams value balloon graphs for their ability to summarize complex data in a single, memorable image.
The balloon graph’s journey reflects a broader trend toward visually rich, interactive, and accessible data storytelling. As visualization platforms evolve, balloon graphs continue to offer unique ways to engage audiences and simplify information.
Advantages and Limitations
The main advantage of a balloon graph is its intuitive and visually appealing format. Viewers can quickly grasp patterns without sifting through dense tables or text. Balloon graphs are ideal for sharing insights with diverse audiences, from executives to students.
Advantages:
- Easy to interpret at a glance
- Visually engaging and memorable
- Able to show multiple variables simultaneously
However, a balloon graph may not be the best choice for detailed, precise analysis. The use of area to represent values can sometimes lead to misinterpretation if not scaled properly or if too many balloons are included. Overly complex visuals can confuse rather than clarify.
Limitations:
- Less precise for exact value comparisons
- Potential for misleading impressions if design is unclear
- Not suitable for large datasets with many overlapping points
Consider using a balloon graph when you want to highlight broad trends or relationships, but opt for bar or line charts for detailed, numeric comparisons. The right choice depends on your data, your audience, and your communication goals.
Why Use Balloon Graphs in 2026?
Balloon graphs are quickly becoming the go-to visual for anyone who wants to make complex data captivating and easy to understand. By 2026, these colorful visuals are expected to be a staple in both business settings and classrooms. Why is this trend accelerating, and how can you benefit? Let us explore the reasons behind the surge in popularity and practical value of the balloon graph.

Making Data More Engaging and Accessible
A balloon graph transforms raw numbers into a visual story, making data more engaging and memorable. Research shows that visuals can improve learning and retention by up to 400 percent, which means your audience is far more likely to understand and recall the information you present. According to recent statistics on data visualization, people process visuals much faster than text, making balloon graphs a powerful tool for both technical and non-technical users.
This type of visualization is especially helpful for students, educators, and business professionals who want to bridge the gap between data complexity and audience understanding. With a balloon graph, even those without a technical background can quickly interpret trends, relationships, and outliers.
Trends in Data Visualization for 2026
The world of data visualization is changing rapidly. In 2026, there is a clear movement towards creative, interactive, and personalized visuals in both business and education. Balloon graphs fit perfectly into this trend by offering a refreshing alternative to standard charts.
As organizations focus more on data democratization and visual literacy, the balloon graph stands out for its flexibility. Users can easily customize colors, sizes, and layouts, making each graph unique to the story they want to tell. This adaptability ensures that balloon graphs remain relevant as expectations for data communication grow more sophisticated.
Real-World Applications
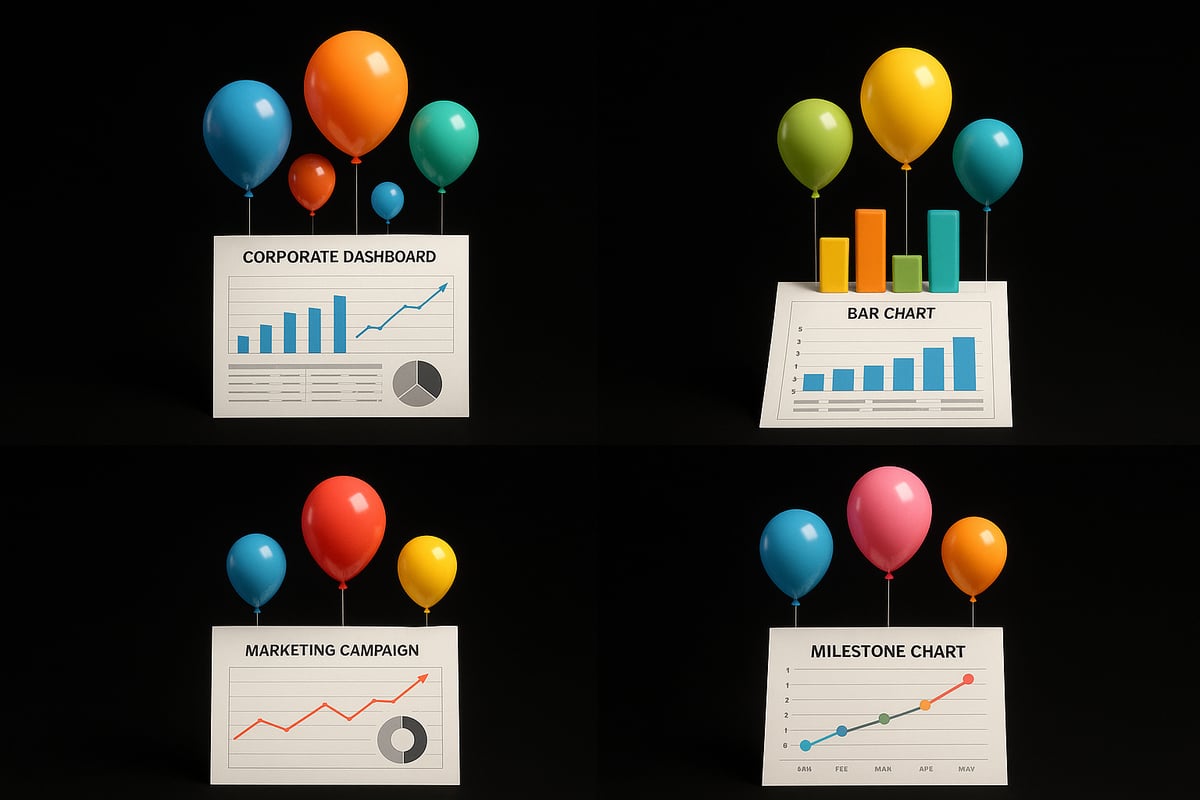
Balloon graphs are finding their place in a variety of real-world scenarios:
- Business dashboards: Visualize sales performance, market share, or customer segments.
- Educational worksheets: Help students map science or math results in a visually appealing way.
- Marketing reports: Track campaign effectiveness and highlight milestones.
- Event planning: Illustrate RSVPs or progress toward event goals.
For example, a teacher might use a balloon graph to compare class test scores, while a marketing manager could use one to showcase campaign reach over time. The versatility of the balloon graph makes it suitable for both professional and creative projects.
Comparing Balloon Graphs to Other Visuals
When it comes to displaying multiple variables, the balloon graph has distinct advantages over traditional bar, line, or scatter plots. Unlike a bar chart that typically shows only one or two variables, a balloon graph can simultaneously represent size, color, and position. This multi-variable capability provides a richer, more nuanced picture.
| Visual Type | Variables Supported | Best Use Case |
|---|---|---|
| Bar Chart | 1-2 | Basic comparisons |
| Line Chart | 1-2 | Trends over time |
| Scatter Plot | 2-3 | Correlations |
| Balloon Graph | 3+ (size, color, position) | Complex, multi-dimensional comparisons |
In scenarios where you need to show complex relationships, the balloon graph often delivers clearer insights than other visuals.
Pitfalls to Avoid
While balloon graphs are powerful, there are common pitfalls to watch out for:
- Adding too many balloons, which can overwhelm viewers
- Using too many variables, leading to confusion
- Choosing colors that are not accessible to all audiences
- Omitting clear legends or labels
To create an effective balloon graph, keep it simple. Limit the number of variables, use colorblind-friendly palettes, and always include labels and legends for clarity. By following these tips, you ensure that your balloon graph communicates insights without causing confusion.
Step-by-Step Guide: How to Create a Balloon Graph
Creating a balloon graph may seem complex at first, but breaking the process into clear steps makes it approachable for everyone. Whether you are a teacher, analyst, or student, following this guide will help you turn raw data into a dynamic, engaging balloon graph that captures attention and delivers insight.
1. Define Your Data and Purpose
The first step to building an effective balloon graph is understanding what you want to communicate. Begin by identifying the variables you need to visualize. For example, you might track sales numbers by region, survey responses by category, or milestones by date.
Clarify your main message. Are you comparing quantities, showing distributions, or highlighting relationships? This will guide your decisions throughout the process.
Ask yourself:
- What story should the balloon graph tell?
- Which variables are most important to display?
- Who is the intended audience?
Common examples include:
- Tracking quarterly sales across multiple regions.
- Visualizing survey results with categories and values.
- Celebrating classroom milestones like reading goals.
By clearly defining your purpose, you ensure your balloon graph remains focused and meaningful. The more specific your data and intent, the more impactful your final visualization will be.
2. Choose the Right Tools and Templates
Selecting the right tool is crucial for crafting a professional balloon graph. Popular options include Excel, Google Sheets, and Power BI. Each platform offers unique features for visualizing data.
Here’s a quick comparison of common tools:
| Tool | Features | Ease of Use | Templates Available |
|---|---|---|---|
| Excel | Advanced charting, shapes | Moderate | Many |
| Google Sheets | Cloud-based, collaboration | Easy | Several |
| Power BI | Interactivity, dashboards | Moderate | Yes |
| Online Makers | Drag-and-drop, quick results | Very Easy | Yes |
Teachers and students may also benefit from printable templates, such as those found on educational sites. Templates can save time and help standardize the look of your balloon graph.
Tips for choosing:
- Match the tool to your technical skill level.
- Consider whether you need digital or printed output.
- Check for compatibility with your data format.
With the right tool or template, you can streamline the balloon graph creation process and focus more on design and analysis.
3. Prepare and Organize Your Data
Before you start designing your balloon graph, ensure your data is accurate and well-organized. Clean your dataset, removing duplicates or errors that could skew results.
Structure your data so that each variable aligns with a visual element in the balloon graph:
- Size: Represents a quantitative value (e.g., sales amount).
- Color: Indicates a category or group (e.g., region or department).
- Position: Shows relationships or distributions along axes.
Example data table for a balloon graph:
| Region | Sales | Category |
|---|---|---|
| North | 120 | Electronics |
| South | 90 | Clothing |
| East | 150 | Furniture |
Decide which variables will map to each visual cue. For instance, sales could determine balloon size, while region sets the color.
Organizing data thoughtfully at this stage ensures your balloon graph is both accurate and easy to interpret for your audience.
4. Design the Balloon Graph
Once your data is ready, you can begin designing your balloon graph. Most users find Excel or Google Sheets effective for this step.
Follow these steps to create your balloon graph:
- Insert a scatter plot or bubble chart as your base.
- Replace data points with shapes (circles or "balloons").
- Adjust the size of each balloon to match your chosen variable.
- Assign distinct colors to represent categories or groups.
- Add clear labels and a legend for context.
If you need detailed guidance, consider referencing resources like Creating Charts in Excel for step-by-step instructions on visual chart creation.
Remember to keep the layout clean. Avoid overlapping balloons and use gridlines to help viewers compare values. Consistent sizing and spacing are key for a professional appearance.
5. Customize for Maximum Impact
Customization elevates your balloon graph from functional to exceptional. Start by applying color schemes that are visually appealing and accessible to all viewers, including those with color vision deficiencies.
Tips for effective customization:
- Use high-contrast palettes for clarity.
- Add annotations to highlight key insights or trends.
- Include descriptive titles and subtitles.
- Incorporate interactive elements if your tool allows (e.g., tooltips or clickable balloons).
Look for inspiration in business dashboards or classroom displays. Well-customized balloon graphs are not only attractive but also make complex data easy to understand.
Always preview your design to ensure every element is visible and the message is clear. A thoughtful approach to customization can make your balloon graph truly stand out.
6. Review and Share Your Balloon Graph
Before sharing your balloon graph, review it carefully for accuracy and clarity. Use this checklist:
- Verify all data points and labels.
- Ensure balloons are correctly sized and colored.
- Check that the legend and annotations are clear.
- Confirm that your graph is free from clutter.
Decide how you want to share your balloon graph:
- Export as a digital image or interactive file.
- Print for classroom or meeting use.
- Embed in presentations, reports, or newsletters.
Sharing a well-reviewed balloon graph boosts your credibility and ensures your audience receives the intended message. Encourage feedback to improve future visualizations and keep refining your approach.
Creative Examples and Use Cases
Balloon graph visuals are transforming how we present data across industries. Their versatility supports dynamic storytelling, making them a favored choice for professionals, educators, marketers, and even individuals working on personal projects. Explore these innovative use cases to see how a balloon graph can elevate your next data presentation.
Business and Corporate Settings
In the business world, a balloon graph brings clarity to complex performance metrics. For example, companies often use balloon graphs to visualize quarterly sales, market share, or employee achievements. Balloons can represent regions, products, or teams, with their size indicating revenue or growth.
Consider a quarterly sales review where each balloon's size reflects the sales figures for a specific region, while color distinguishes product categories. This makes it easy for executives to spot trends and outliers at a glance.
For streamlined reporting, many organizations leverage Excel Templates for Reports, enabling seamless integration of balloon graph visuals into dashboards and presentations. This not only saves time but also enhances data-driven discussions.
Education and Classroom Activities
Balloon graph worksheets are engaging tools for students and teachers. In classrooms, teachers use balloon graphs to help students chart experiment results, compare survey responses, or visualize class progress on projects.
For instance, a science teacher might assign students to record plant growth over several weeks and display their findings with a balloon graph. Each balloon could represent a different plant, with size correlating to growth and color to species.
Printable balloon graph templates, such as those from educational resources, make it easy to adapt these visuals to any subject or grade level. This hands-on approach fosters both data literacy and creativity in young learners.
Marketing and Event Planning
Marketing teams turn to balloon graph designs for campaign tracking, audience segmentation, or event planning. For a product launch, a balloon graph can illustrate RSVP numbers, social media engagement, or sales milestones, with each balloon representing a channel or time period.
Event planners use balloon graphs to visualize guest lists, meal preferences, or gift distributions. For example, a birthday balloon graph can make team member recognition festive and visually memorable, highlighting milestones with vibrant colors and playful design.
These creative visuals are also ideal for marketing reports, making data accessible and engaging for clients and stakeholders.
Personal Projects and Data Storytelling
A balloon graph is an excellent tool for personal data visualization. Individuals use them to track fitness goals, celebrate family milestones, or document achievements over time.
Imagine mapping your daily step count, where each balloon reflects a day's activity, or creating a custom anniversary balloon graph to visualize shared experiences. This format turns ordinary data into a compelling story that is easy to share with friends and family.
The customizable nature of a balloon graph allows for endless creativity, ensuring personal projects are both meaningful and visually appealing.
Digital and Print Media
In digital and print media, balloon graphs add visual interest to infographics, newsletters, and social media posts. Their playful yet informative style captures attention and makes complex data more approachable.
Designers incorporate balloon graph visuals to summarize survey results, highlight key statistics, or animate trends over time. This approach increases engagement and helps audiences quickly grasp essential insights.
Whether featured in a corporate newsletter or a classroom handout, balloon graph graphics bridge the gap between data and understanding, making information memorable and actionable.
Advanced Tips: Customizing Balloon Graphs for Maximum Creativity
Unlocking the full potential of a balloon graph means going beyond the basics. By mastering customization, you can turn any balloon graph into a vibrant, interactive, and accessible masterpiece.
Incorporating Multiple Variables
A balloon graph excels at displaying complex datasets through visual variables. You can encode up to three or more variables by adjusting balloon size, color, position, and even shape.
For example, use size to show sales volume, color to represent regions, and position to indicate product categories. Shape customization lets you distinguish between data types or highlight special categories.
To achieve this in Excel or Power BI, explore Advanced Excel Visualization Tools, which offer advanced controls for mapping multiple variables in your balloon graph.
Interactive and Animated Balloon Graphs
Interactivity brings your balloon graph to life. Add hover effects to reveal details, or make balloons clickable to filter data. Animation can illustrate trends over time, such as growth or decline.
Modern tools allow you to animate balloons so viewers can watch data change year by year. Interactive dashboards built in Excel, Power BI, or web platforms enable users to engage deeply with your balloon graph.
Try using built-in animation features or plugins, and always preview your interactive balloon graph to ensure smooth performance and clarity.
Accessibility and Inclusivity
Designing a balloon graph for everyone means considering accessibility from the start. Choose high-contrast color palettes, such as blue and orange, to help colorblind users distinguish balloons.
Label each balloon clearly, use large fonts, and add descriptive alternative text for screen readers. If your balloon graph will be printed, test grayscale versions to ensure legibility.
Accessible balloon graph design opens your insights to a wider audience, making your data both beautiful and usable.
Common Mistakes and How to Avoid Them
Even the most creative balloon graph can fall short if not carefully designed. Watch out for overcrowding, which makes it hard to interpret data. Limit the number of balloons and variables to maintain clarity.
Avoid poor color choices or unclear legends. Always use a legend that explains every visual element, and select colors that contrast well. Test your balloon graph with colleagues to catch any confusing elements before sharing.
A clear, well-structured balloon graph delivers insights at a glance and avoids misleading your audience.
Future Trends in Balloon Graph Design
Looking ahead to 2026, balloon graph design will benefit from innovations like AI-driven customization, augmented reality overlays, and real-time data integration.
Expect tools to suggest optimal layouts, automatically adjust for accessibility, and even create animated balloon graphs for immersive experiences. For more on these upcoming trends, see Top 15 Data Visualization Trends in 2026.
Staying updated ensures your balloon graph remains at the forefront of creative data visualization.
Balloon Graphs in Education: Enhancing Learning and Engagement
Balloon graph visualizations are transforming classrooms by turning abstract data into vibrant, interactive experiences. Teachers and students now use these tools to bridge the gap between theory and real-world understanding. In 2026, the balloon graph is more than a chart, it is a catalyst for curiosity and engagement.
Benefits for Teachers and Students
A balloon graph helps demystify numbers for students by making data visual, tangible, and fun. When learners see information represented as colorful balloons, abstract ideas become easier to grasp. This approach sparks interest and motivates participation.
Key advantages include:
- Visualizing complex relationships with ease
- Encouraging collaborative discussions
- Supporting diverse learning styles
Incorporating a balloon graph into lessons can boost student confidence as they interpret and present data visually. This hands-on method fosters deeper understanding of patterns and trends.
Curriculum Integration and Standards Alignment
Integrating balloon graph activities aligns seamlessly with math, science, and social studies standards. Teachers can use balloon graphs to illustrate data analysis, probability, or statistical concepts. For example, students might analyze weather patterns or survey results, mapping findings onto a balloon graph for clearer insights.
These activities meet curriculum goals by:
- Reinforcing data literacy skills
- Promoting critical thinking and comparison
- Supporting project-based learning
When students create balloon graphs, they practice interpreting data and drawing conclusions, skills that are essential for academic success.
Printable and Digital Resources
Teachers have access to a wide range of printable and digital balloon graph templates suitable for various grade levels. Customizable worksheets allow educators to tailor activities to their classroom needs. For digital tasks, platforms like Excel or Google Sheets can be used to make interactive balloon graphs.
Before visualizing, students can prepare and analyze their data using tools such as Data Analysis with Excel. This ensures accuracy and helps learners understand the process of turning raw information into meaningful visuals.
Tips for effective resources:
- Choose colorblind-friendly palettes
- Provide clear instructions and sample data
- Encourage students to experiment with design
Assessment and Feedback
A balloon graph serves as a valuable tool for formative assessment. Teachers can use student-created graphs to gauge understanding of concepts like comparison or distribution. Peer review sessions, where students critique each other's balloon graphs, promote collaboration and constructive feedback.
Educators can assess:
- Accuracy of data representation
- Clarity of labels and legends
- Effectiveness of visual storytelling
This approach supports ongoing feedback and helps students reflect on their learning progress.
Encouraging Creativity and Data Literacy
Designing a balloon graph empowers students to think creatively and develop essential data literacy skills. When learners select variables, assign colors, and determine balloon sizes, they become active participants in the storytelling process.
Ways to foster creativity:
- Invite students to visualize personal milestones or class achievements
- Challenge students to present the same data in multiple formats
- Host data visualization contests using balloon graphs
By encouraging experimentation, teachers inspire students to see data as a dynamic, engaging subject.