Every decision, from business investments to scientific discoveries, hinges on understanding how data points relate to one another. Recognizing these relationships can reveal hidden patterns and opportunities that drive success.
This guide is designed to walk you through how to find correlation coefficient in excel, using the latest features available in 2026. Whether you are a business analyst, researcher, or Excel enthusiast, mastering this skill empowers you to make informed, data-driven choices.
You will learn the fundamentals of correlation, step-by-step Excel methods, troubleshooting tips, and real-world applications. Ready to unlock deeper insights from your data? Let’s begin your journey to mastering correlation analysis in Excel.
Understanding Correlation and Correlation Coefficient in Excel
Understanding how to find correlation coefficient in excel starts with a solid grasp of what correlation means in the context of data analysis. Correlation measures the relationship between two or more variables, helping us uncover patterns that drive business, scientific, and everyday decisions.

What is Correlation in Data Analysis?
Correlation is a statistical concept that indicates how strongly two variables move together. In practice, it helps analysts and decision-makers understand whether increases in one variable are associated with increases or decreases in another. For example, in finance, correlation might reveal how stock prices move in relation to economic indicators. In marketing, it helps identify if higher ad spend leads to more sales. Science often uses correlation to examine relationships between experimental variables.
It is crucial to remember that correlation does not imply causation. Just because two variables have a strong correlation does not mean that one causes the other. Mastering how to find correlation coefficient in excel allows you to identify these relationships, but interpreting them correctly is key to making sound decisions.
Types of Correlation and Their Interpretation
There are three primary types of correlation: positive, negative, and zero. Positive correlation means that as one variable increases, the other also increases. Negative correlation indicates that as one rises, the other falls. Zero correlation suggests no discernible relationship between the variables.
| Correlation Type | Example in Excel Data | Coefficient Value |
|---|---|---|
| Positive | Sales and advertising spend | +1 (strong) |
| Negative | Temperature and heating cost | -1 (strong) |
| Zero | Shoe size and income | 0 |
In business data, strong correlations (close to +1 or -1) might appear between revenue and marketing, while weak or no correlation could show up in unrelated data sets. Knowing how to find correlation coefficient in excel helps you spot these patterns quickly.
The Correlation Coefficient: Meaning and Formula
The Pearson correlation coefficient is the most common way to quantify correlation. The formula is:
r = Σ[(xi - x̄)(yi - ȳ)] / [√Σ(xi - x̄)² * √Σ(yi - ȳ)²]
Where:
xi,yi= individual data pointsx̄,ȳ= means of x and yn= number of paired values
The coefficient ranges from -1 (perfect negative) through 0 (no correlation) to +1 (perfect positive). For example, in a sample dataset comparing study hours and exam scores, a coefficient near +1 means students who study more tend to score higher. Mastering how to find correlation coefficient in excel gives you the mathematical backing to analyze these relationships with confidence.
Why Use Excel for Correlation Analysis?
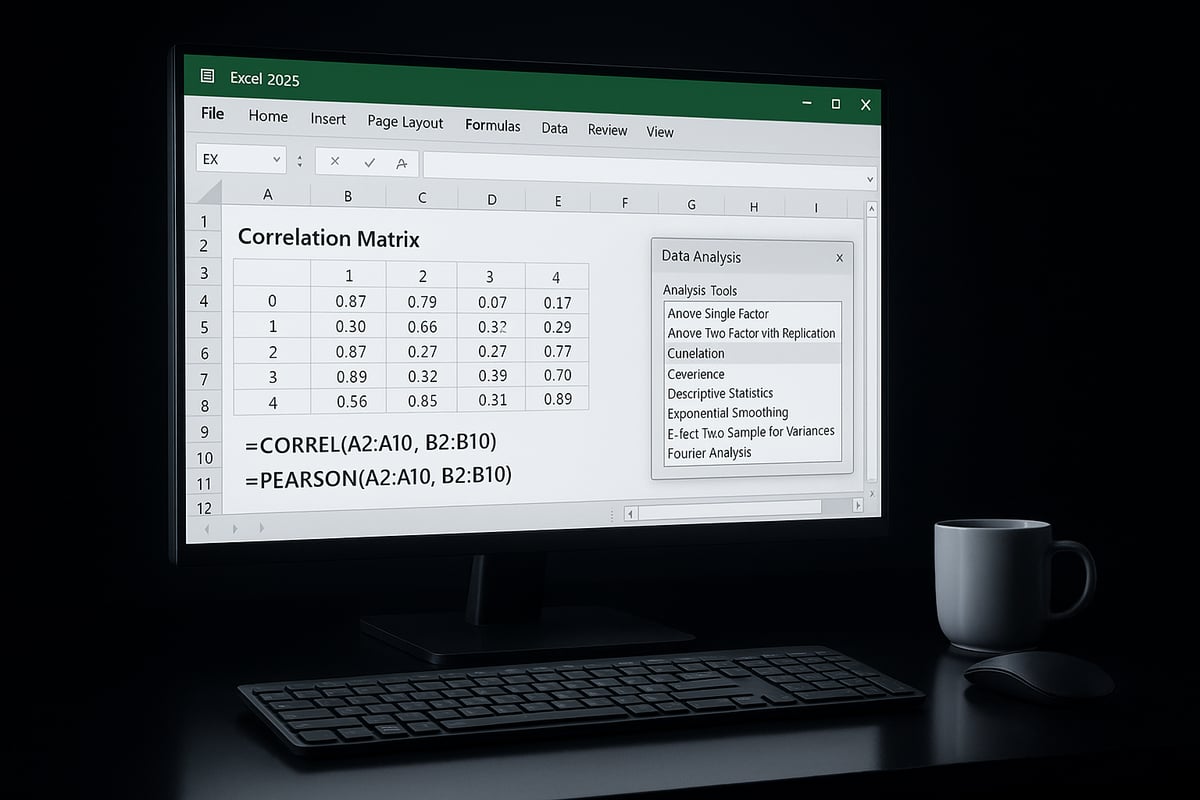
Excel remains the go-to tool for data analysis because it is accessible, widely used, and packed with built-in correlation features. Whether you use the CORREL or PEARSON functions, or leverage the Data Analysis ToolPak, Excel streamlines the process for users at any skill level.
Compared to programming tools like R or Python, Excel requires no coding and offers visual, interactive analysis. As of 2024, it is still the most popular spreadsheet platform for business analytics. For a deeper dive into related techniques, you can explore data analysis techniques in Excel to broaden your toolkit. Knowing how to find correlation coefficient in excel ensures you can harness these advantages for everyday analysis.
Methods to Find Correlation Coefficient in Excel
Understanding how to find correlation coefficient in Excel is key for anyone analyzing relationships between variables. Excel offers several built-in methods designed to simplify this process for users at any skill level. Whether you're working with simple pairs of data or complex datasets, Excel provides flexible options to calculate correlation efficiently.
Overview of Available Methods in Excel
When considering how to find correlation coefficient in Excel, you can choose from three primary methods:
- CORREL function: A straightforward formula for comparing two data sets.
- Data Analysis ToolPak: An add-in that generates correlation matrices for multiple variables.
- PEARSON function: Another formula option that delivers the same result as CORREL.
Each method suits different scenarios. For quick two-variable analysis, formulas are ideal. For larger datasets, ToolPak provides batch processing. All methods are compatible with Excel 2016, 2019, 2021, Office 365, and anticipated 2026 updates. Selecting the right method ensures accurate analysis for your specific data.
Method 1: Using the CORREL Function
The CORREL function is one of the most popular answers to how to find correlation coefficient in Excel. It works well for comparing two variables quickly and directly.
Syntax:
=CORREL(array1, array2)
- array1: First range of values.
- array2: Second range of values.
Step-by-step example:
- Enter your data into two columns, e.g., A2:A13 (sales), B2:B13 (advertising spend).
- In an empty cell, type
=CORREL(A2:A13, B2:B13). - Press Enter to see the correlation coefficient.
For more detail on syntax and troubleshooting, consult the CORREL function documentation.
Interpreting results:
A result close to 1 indicates strong positive correlation, -1 means strong negative, and 0 suggests no relationship.
Common pitfalls:
- Ranges must be equal in length.
- Avoid blank cells or text entries within your ranges.
This method is ideal when learning how to find correlation coefficient in Excel for two numeric datasets.
Method 2: Using Data Analysis ToolPak
The Data Analysis ToolPak is perfect for users who need to analyze multiple variables at once or prefer a visual approach to how to find correlation coefficient in Excel.
Steps:
- Enable ToolPak: Go to File > Options > Add-Ins, select Analysis ToolPak, and click Go to enable.
- Access: Click the Data tab, then Data Analysis.
- Choose Correlation from the list.
- Specify your input range (e.g., A1:C13 for three variables), select columns or rows, and define your output location.
- Click OK to generate a correlation matrix.
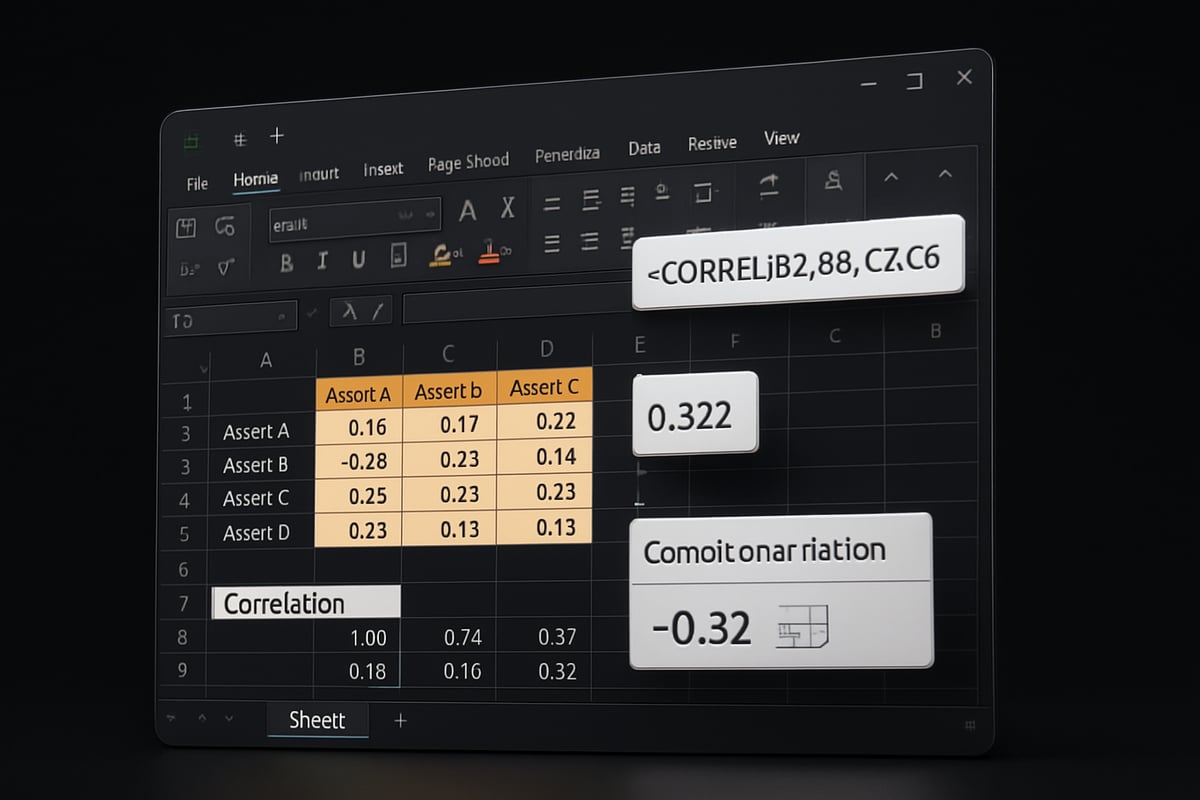
A correlation matrix displays the coefficients between all possible variable pairs, making it easy to spot patterns or multicollinearity.
Advantages:
- Batch process multiple variables.
- Results appear in a formatted table.
- Useful for large or complex datasets.
For those exploring how to find correlation coefficient in Excel across several metrics, ToolPak is highly efficient and user-friendly.
Method 3: Using the PEARSON Function
The PEARSON function provides another formula-based solution for how to find correlation coefficient in Excel, especially for users familiar with statistical terminology.
Syntax:
=PEARSON(array1, array2)
Like CORREL, it compares two data sets and produces a value between -1 and 1. For example, to analyze the correlation between outside temperature and ice cream sales, input your data and use =PEARSON(A2:A13, B2:B13).
PEARSON and CORREL yield identical outputs, so choose the one that best fits your workflow or reporting standards. This function is effective for users who may already use statistical functions in their analysis process.
Step-by-Step Guide: Calculating Correlation Coefficient in Excel
Understanding how to find correlation coefficient in excel empowers you to reveal hidden relationships within your data. Whether you are analyzing business trends or scientific variables, Excel offers several intuitive methods to calculate this essential metric. This guide walks you through each step, ensuring accurate results and clear interpretation.
Preparing Your Data for Analysis
Before learning how to find correlation coefficient in excel, start by ensuring your data is clean and well-structured. Place each variable in its own column or row, label all headers clearly, and keep data types consistent.
Remove any blank cells or non-numeric entries to prevent calculation errors. If your dataset contains missing values, either fill them with appropriate estimates or remove affected rows entirely. Outliers can distort results, so scan for extreme values and decide whether to adjust or exclude them.
For best results, use Excel’s built-in data validation tools to maintain data integrity. They help prevent accidental entry of text in numeric ranges or inconsistent formats. For an in-depth checklist on preparing your spreadsheets, see this guide on data validation rules in Excel.
By taking these steps, you lay the foundation for reliable correlation analysis and minimize the risk of misleading conclusions.
Calculating Correlation Coefficient with the CORREL Function
The CORREL function is one of the most direct ways to learn how to find correlation coefficient in excel. Use =CORREL(array1, array2) where array1 and array2 are the ranges you want to compare.
Step-by-step example:
- Enter your data in two columns: A (Monthly Revenue) and B (Marketing Spend).
- In an empty cell, type
=CORREL(A2:A13, B2:B13). - Press Enter to see the correlation coefficient.
| Month | Revenue | Marketing Spend |
|---|---|---|
| Jan | 10000 | 2000 |
| Feb | 12000 | 2500 |
| … | … | … |
A result close to 1 indicates a strong positive relationship, while a result near -1 signals a strong negative correlation.
Common issues include mismatched range sizes or blank cells, which can produce errors like #N/A or #DIV/0!. Double-check the ranges and ensure no missing data.
For more detailed step-by-step examples, you can also consult this Calculating Correlation in Excel guide for additional insights.
Calculating Correlation Coefficient with the Data Analysis ToolPak
If you want to analyze several variables at once, the Data Analysis ToolPak is an efficient option for how to find correlation coefficient in excel.
How to use the ToolPak in Excel 2026:
- Enable the ToolPak: Go to File > Options > Add-Ins. In the Manage box, select Excel Add-ins, check “Analysis ToolPak,” then click OK.
- Go to the Data tab and click “Data Analysis.”
- Select “Correlation” from the list and click OK.
- Input your data range (e.g., A1:C13 for three variables), specify if data is grouped by columns, and choose an output location.
- Click OK to generate a correlation matrix.
This matrix displays the correlation coefficient between each pair of variables. For large datasets, the ToolPak saves time and avoids repetitive calculations.
Review the matrix for values close to 1 or -1, as these indicate strong relationships. Make sure your input ranges are correct and contain no blanks for accurate results.
Calculating Correlation Coefficient with the PEARSON Function
The PEARSON function is another reliable method for how to find correlation coefficient in excel. Use the syntax =PEARSON(array1, array2) to compute the coefficient.
Suppose you have temperature data in column A and ice cream sales in column B. Enter =PEARSON(A2:A31, B2:B31) in an empty cell. The output should closely match the result from CORREL, as both functions calculate the Pearson correlation coefficient.
Use PEARSON if you prefer explicit reference to the statistical method or want to align with scientific reporting standards.
Creating and Interpreting a Correlation Matrix in Excel
A correlation matrix allows you to examine relationships among multiple variables simultaneously, making it a powerful tool for anyone learning how to find correlation coefficient in excel.
How to create a matrix:
- Prepare your data in adjacent columns, ensuring each variable is clearly labeled.
- Use the Data Analysis ToolPak’s Correlation feature as described above.
- Excel will output a table showing the coefficient for every variable pair.
| Sales | Marketing | Satisfaction | |
|---|---|---|---|
| Sales | 1.00 | 0.85 | 0.78 |
| Marketing | 0.85 | 1.00 | 0.65 |
| Satisfaction | 0.78 | 0.65 | 1.00 |
Interpret values close to 1 or -1 as strong relationships, and values near 0 as weak or no correlation. Use the matrix to spot multicollinearity before regression analysis and to guide deeper investigations into your data.
Troubleshooting and Best Practices for Correlation Analysis in Excel
Running a correlation analysis in Excel is powerful, but small mistakes can lead to misleading results. Whether you are new or experienced, knowing how to find correlation coefficient in excel accurately requires careful troubleshooting and adherence to best practices.

Common Issues and How to Fix Them
When learning how to find correlation coefficient in excel, users often encounter common pitfalls that can skew analysis. Formatting errors occur if text is mixed with numbers, or if blank cells are present in your data ranges. Inconsistent data types might trigger errors like #VALUE! or #N/A. Selecting the wrong cell range is another frequent issue that leads to unreliable results or calculation errors.
Another stumbling block is a missing or disabled Data Analysis ToolPak. Without this add-in, you cannot generate correlation matrices for multiple variables. If you see messages such as Can't find Data Analysis ToolPak, follow these steps:
- Go to
File>Options>Add-ins - Choose
Excel Add-insand checkAnalysis ToolPak - Click
OKto enable
For more on minimizing spreadsheet errors and safeguarding your workflow, see Reducing spreadsheet errors in Excel.
Ensuring Accurate Results: Data Preparation and Validation
A clean dataset is essential when you are exploring how to find correlation coefficient in excel. Before analysis, remove duplicates and ensure every column contains only numeric values. Use Excel’s data validation tools to prevent unexpected entries. If your dataset contains missing values, fill them appropriately or remove affected rows to maintain accuracy.
Outliers can dramatically influence your correlation coefficient. For example, a single extreme value in a small dataset can flip a weak correlation to strong. To identify outliers, use conditional formatting or sort your data columns. Always label your variables clearly so results are easy to interpret and share.
Interpreting Correlation Results Correctly
Understanding how to find correlation coefficient in excel is only half the challenge. Interpreting the output correctly is crucial. A common error is assuming correlation means causation, which is not always true. For example, two variables might be highly correlated due to a third unseen factor.
Industry standards for “strong” or “weak” correlation vary, so always consider your context. Visual tools like scatter plots can help confirm relationships—Excel’s charting features make this simple. If your data is noisy or contains many unrelated variables, expect weaker correlations. Always check your results visually and statistically before making decisions.
Advanced Tips for Reliable Analysis
Once you master the basics of how to find correlation coefficient in excel, enhance your workflow with advanced strategies. Use conditional formatting in correlation matrices to quickly spot strong or weak relationships. Automate repetitive analysis with macros or VBA scripts, especially for large or frequent datasets.
Exporting your correlation tables for reports or presentations is straightforward with Excel’s copy and paste tools. Stay informed about new Excel features for 2026, as Microsoft continually improves data analysis functionality. Regularly review your data practices and keep learning to ensure your results remain accurate and actionable.
Practical Applications of Correlation Coefficient in Excel
Understanding how to find correlation coefficient in excel is more than a technical skill—it is a gateway to smarter, data-driven decisions. In every industry, the ability to uncover relationships between variables can reveal opportunities, prevent costly mistakes, and drive innovation. Let us explore how correlation analysis in Excel brings value to real-world scenarios, supports research, and empowers strategic action.
Real-World Business and Research Scenarios
Businesses and researchers rely on how to find correlation coefficient in excel to uncover trends and relationships that matter. In finance, analysts study the correlation between different asset returns to optimize portfolios and manage risk. Marketing teams evaluate the impact of advertising spend on sales, using correlation to fine-tune campaign strategies. Human resources departments examine links between employee engagement scores and productivity metrics. Scientists, too, use correlation analysis to identify relationships between experimental variables, such as dosage and response rates. Across these fields, Excel serves as the common platform for accessible, robust correlation analysis.
Case Studies and Examples
Let us look at practical examples where knowing how to find correlation coefficient in excel transforms raw data into actionable insights. For instance, a digital marketing team compares website traffic with conversion rates to see if more visitors lead to higher sales. In education, researchers analyze the relationship between student study hours and exam scores. Healthcare professionals may investigate the correlation between treatment protocols and patient recovery times. For a step-by-step approach to visualizing these relationships, see Creating Scatterplots and Finding Correlation Coefficient in Excel, which demonstrates how to bring data to life in Excel and interpret results with confidence.
Using Correlation Matrices for Multivariate Analysis
When working with multiple variables, a correlation matrix in Excel is an essential tool for those learning how to find correlation coefficient in excel. This matrix allows users to analyze patterns among several variables simultaneously, making it easier to detect multicollinearity—a critical factor in regression analysis. For example, a business might create a correlation matrix for sales, costs, and profit margins to identify which variables move together. Visualizing these relationships with Excel’s charting tools, such as heatmaps or color-coded tables, helps teams quickly spot significant correlations and prioritize areas for deeper analysis.
Integrating Correlation Analysis into Decision-Making
Mastering how to find correlation coefficient in excel empowers organizations to make data-driven decisions. Businesses use correlation findings to set benchmarks, design KPIs, and forecast trends. By combining correlation analysis with other Excel tools, such as pivot tables and reports, teams can build comprehensive dashboards that track performance and uncover hidden drivers of success. Ongoing analysis ensures companies stay agile, adjusting strategies as new data emerges. For any team, integrating correlation into regular reporting cycles leads to more informed, proactive decision-making.
Free and Expert Help for Excel Correlation Analysis
Struggling with how to find correlation coefficient in excel, or looking to elevate your data analysis skills? Getting expert guidance can save you time, prevent errors, and help you unlock deeper insights from your data.
Meet The Analytics Doctor, a trusted specialist dedicated to diagnosing and resolving spreadsheet challenges. Whether you are a beginner or an advanced Excel user, The Analytics Doctor offers tailored support for all aspects of how to find correlation coefficient in excel and more.
Services include:
- Personalized troubleshooting for Excel formulas and functions
- One-on-one or group training sessions focused on correlation analysis and data interpretation
- Custom automation of repetitive analytics and reporting tasks
- Assistance with complex workbook structures and data workflows
- Guidance on creating and interpreting correlation matrices in Excel
Every solution is practical and designed to match your skill level, ensuring you not only learn how to find correlation coefficient in excel but also gain confidence in applying these techniques to real-world scenarios. The Analytics Doctor provides ongoing support, so you always have an expert to turn to when new challenges arise.
In addition to expert consulting, a wide range of free resources, step-by-step guides, and introductory consulting sessions are available. These tools help you get started quickly and ensure you have reliable answers as you work through your data.
Ready to master how to find correlation coefficient in excel and maximize your analytical capabilities? Visit The Analytics Doctor for expert help and start transforming your Excel experience today.