Unlock the power of your data with Microsoft Excel, even if you are new to spreadsheets. Many people find ms excel data analysis overwhelming at first, but you are not alone. Excel is trusted by over 750 million users worldwide for its accessibility and robust features.
Imagine turning raw numbers into clear, actionable insights. You do not need to be an expert to start analyzing your data. This practical guide will walk you step-by-step through the essentials of ms excel data analysis for 2025.
You will learn how to prepare and import data, use key analysis tools and formulas, visualize results, and apply best practices—making Excel work for you from day one.
Understanding Data Analysis in Excel
Unlocking the full potential of ms excel data analysis begins with understanding what data analysis means and why Excel remains the go-to tool for millions. Whether you are tracking sales, monitoring trends, or making business decisions, Excel empowers users at every skill level to transform raw information into clear, actionable insights.

What is Data Analysis and Why Use Excel?
Data analysis is the process of inspecting, cleaning, and modeling data to discover useful information, support decision-making, and uncover trends. For beginners and professionals alike, ms excel data analysis is a top choice due to its accessibility, intuitive interface, and robust features.
Excel is trusted by over 750 million users worldwide. Its versatility is unmatched, allowing even small businesses to analyze sales data with ease. In fact, over 80% of organizations rely on Excel for data-related tasks (Forbes, 2023). For more on Excel’s significance in the data analysis landscape, see Excel’s Role in Data Analysis.
Types of Data You Can Analyze in Excel
Ms excel data analysis supports a wide variety of data types, making it suitable for nearly any scenario. Numeric data, such as sales figures, can be quickly summarized. Categorical data, like product categories or customer segments, is easily grouped and filtered.
Time-series data, such as monthly expenses, and text data, like customer feedback, are also manageable in Excel. Each data type fits naturally into Excel’s cells, tables, and ranges, giving users the flexibility to analyze what matters most.
Key Excel Features for Data Analysis
The heart of ms excel data analysis lies in its built-in tools. Tables organize information for easy sorting and filtering. PivotTables allow you to create powerful summaries and spot trends in seconds. Charts and graphs make visualizing data straightforward, even for beginners.
Excel 2025 introduces improvements like enhanced formula suggestions and a streamlined interface. For example, a PivotTable can instantly summarize sales by region, helping you identify top performers and areas for improvement.
| Feature | Benefit | Example Use |
|---|---|---|
| Tables | Structured analysis | Expense tracking |
| PivotTables | Quick summarization | Sales by category |
| Charts | Clear visualization | Revenue trends |
| Formulas | Automated calculations | Profit margins |
Limitations of Excel for Data Analysis
While ms excel data analysis is powerful, it has limitations. Large files may slow down performance, and handling millions of rows is challenging. Manual data entry increases the risk of errors, which can affect data integrity.
For complex or massive datasets, tools like Power BI or Python may be better suited. Recognizing these limitations early helps you decide when Excel is the right tool and when to consider alternatives.
Common Beginner Challenges (and Solutions)
Beginners often face hurdles with ms excel data analysis, such as data entry mistakes, incorrect formulas, and unorganized datasets. Clean data is the foundation of effective analysis, yet it is easy to overlook simple errors.
Quick solutions include using data validation, leveraging built-in templates, and following step-by-step guides. These practices help minimize errors and ensure your analysis remains accurate and reliable.
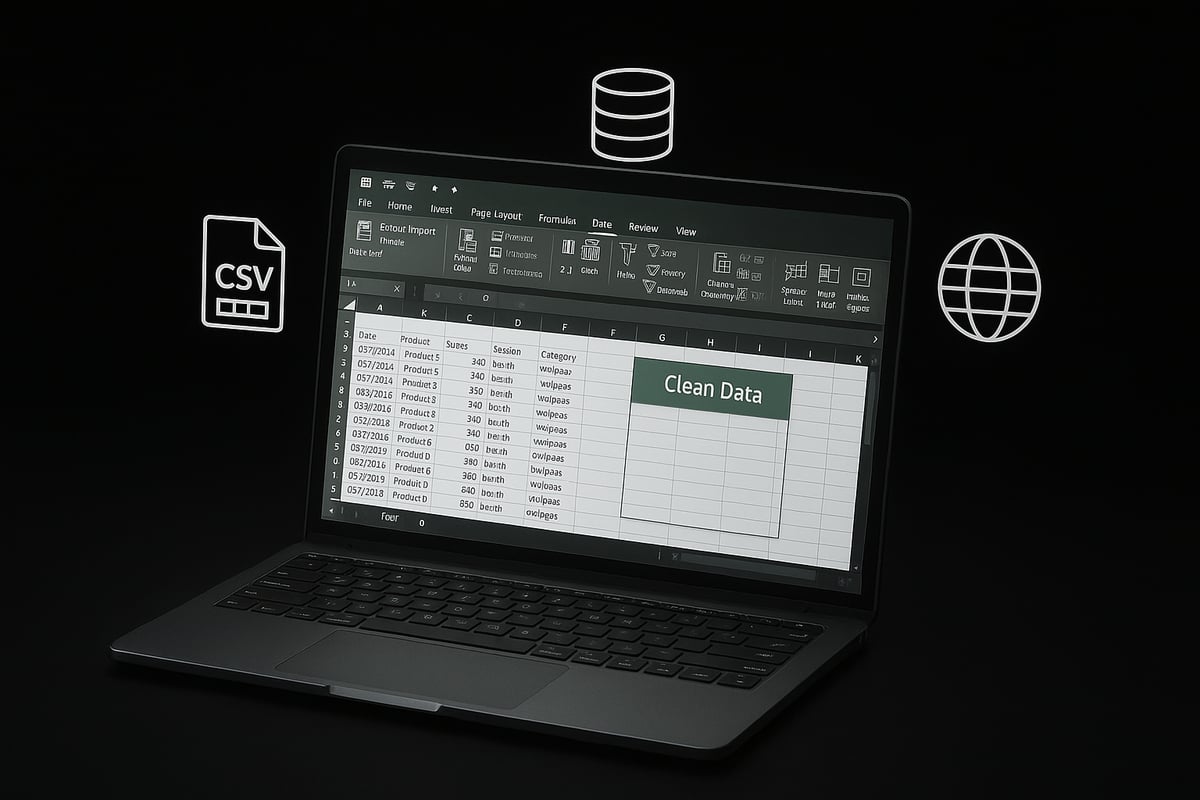
Preparing and Importing Data in Excel
Before you can unlock insights with ms excel data analysis, you need to gather, import, and structure your data correctly. This foundational step ensures every analysis is accurate and powerful, whether you are working with sales figures, survey results, or inventory lists.
Gathering and Organizing Data Sources
The first step in ms excel data analysis is sourcing your data from reliable origins. Common sources include CSV files, databases, websites, or internal business systems.
To ensure accuracy and relevance:
- Always verify your data source is up-to-date and trustworthy.
- Prefer official or reputable sites for sample datasets, such as government portals or academic resources.
- Save data in structured formats like CSV or TXT for easier importing.
For example, if you want to analyze monthly expenses, download a CSV file from your bank’s online portal or a sample dataset from an official statistics website. Organizing your files in dedicated folders also streamlines your ms excel data analysis workflow.
Importing Data into Excel
Once you have your data, importing it into Excel is straightforward thanks to the “Get Data” feature. Start your ms excel data analysis by opening Excel, selecting the “Data” tab, and choosing “Get Data.” You can import CSV, TXT, or even data directly from the web.
Follow these steps:
- Click “Get Data.”
- Choose the file type (CSV, TXT, Web, etc.).
- Browse to your file or enter the web link.
- Use the import wizard to preview and configure columns.
Excel 2025 introduces an improved import wizard, making it easier to map columns and detect data types. If you encounter import errors, double-check file encoding or column delimiters to keep your ms excel data analysis smooth.
Cleaning and Formatting Data
Clean data is the backbone of ms excel data analysis. Start by removing duplicates, correcting errors, and standardizing formats.
Essential cleaning steps:
- Use the “Remove Duplicates” tool to avoid counting the same data twice.
- Apply “Text to Columns” for splitting combined fields, such as names or addresses.
- Use “Find & Replace” to correct recurring mistakes or unify formats.
For instance, ensure all dates follow the same format (e.g., MM/DD/YYYY) and currency fields are consistent. If duplicate entries are a concern, check out this helpful How to Check Duplicates in Excel guide for step-by-step instructions. This attention to detail sets the stage for reliable ms excel data analysis.
Structuring Data for Analysis
The way you structure your data determines how easily you can perform ms excel data analysis. Excel tables offer several advantages over plain ranges, including automatic filtering, easy referencing, and better formatting.
Best practices:
- Always use descriptive headers for each column.
- Convert raw lists into structured tables using the “Format as Table” tool.
- Maintain consistent data types in each column for accurate calculations.
Here’s a quick comparison:
| Feature | Table | Range |
|---|---|---|
| Auto-filtering | Yes | No |
| Dynamic formulas | Yes | No |
| Easy referencing | Yes | No |
For more on turning your data into powerful tables, visit the Create and Use Excel Tables guide. Structuring your data correctly ensures your ms excel data analysis yields meaningful results.
Essential Excel Functions and Formulas for Data Analysis
Unlocking the full potential of ms excel data analysis starts with mastering essential functions and formulas. As a beginner, understanding these tools will empower you to interpret data, automate calculations, and gain actionable insights. Let’s explore the foundational building blocks you need for effective analysis.
Fundamental Excel Functions for Beginners
The foundation of ms excel data analysis lies in core functions like SUM, AVERAGE, COUNT, MIN, and MAX. These are the starting point for any beginner.
For example, to calculate total sales, select a range and use =SUM(A2:A100). To find the average score, use =AVERAGE(B2:B100). Counting entries is easy with =COUNT(C2:C100). Identifying the smallest and largest values? Use =MIN(D2:D100) and =MAX(D2:D100).
Here’s a quick reference table:
| Function | Purpose | Example Use |
|---|---|---|
| SUM | Total values | Total sales |
| AVERAGE | Find mean | Test scores |
| COUNT | Count entries | Number of orders |
| MIN | Smallest value | Lowest expense |
| MAX | Largest value | Highest revenue |
Mastering these basics is crucial for ms excel data analysis, providing a strong base for more advanced techniques.
Logical and Lookup Functions
Logical and lookup functions are essential for ms excel data analysis, enabling you to automate decision-making and retrieve information efficiently.
The IF function lets you set conditions, such as =IF(A2>1000,"High","Low") to label sales as high or low. Combine AND or OR to create more complex logic: =IF(AND(B2>500,C2="Yes"),"Qualified","Not Qualified").
Lookup functions are powerful for finding data. VLOOKUP and XLOOKUP help pull information from tables. For example, use =VLOOKUP(D2,SalesTable,3,FALSE) to find a customer’s region. XLOOKUP, new in recent versions, is more flexible: =XLOOKUP(E2,IDList,NameList).
If you want step-by-step guidance, check out this How to Create PivotTables resource for practical lookup and summary tips.
These logical and lookup functions streamline ms excel data analysis, especially with large datasets.
Text and Date Functions
Text and date functions are vital for cleaning and organizing data in ms excel data analysis. Functions like LEFT, RIGHT, and MID help extract specific parts from text. For example, =LEFT(A2,4) pulls the first four characters, while =RIGHT(B2,2) grabs the last two.
CONCAT and TEXT are useful for combining and formatting. Use =CONCAT(A2," ",B2) to merge first and last names. The TEXT function lets you format numbers or dates, such as =TEXT(C2,"$#,##0.00").
Date functions like TODAY() and DATE() keep your analysis current. To extract the month, use =MONTH(D2). These tools make ms excel data analysis more organized and efficient, especially when dealing with messy or imported data.
Statistical Functions
Statistical functions allow you to dig deeper into your data with ms excel data analysis. Use MEDIAN to find the middle value: =MEDIAN(A2:A100). MODE shows the most common number: =MODE(B2:B100).
To analyze how data points vary, try STDEV: =STDEV(C2:C100). For exploring relationships, CORREL checks the correlation between two sets: =CORREL(D2:D100,E2:E100).
These functions are invaluable for analyzing survey results, identifying trends, or summarizing performance. Incorporating statistical functions ensures your ms excel data analysis is both robust and insightful.
Error Handling and Troubleshooting Formulas
No ms excel data analysis is complete without error handling. Mistakes in formulas are common, so functions like IFERROR and ISERROR are essential. Wrap calculations in =IFERROR(formula,"Check Data") to display a message instead of an error.
To spot issues, use ISERROR: =ISERROR(A2/B2). Excel’s Formula Auditing tools, found in the Formulas tab, let you trace precedents and dependents, helping you debug complex calculations.
Always test formulas on sample data before scaling up. These troubleshooting techniques keep your ms excel data analysis accurate and reliable.
Using Named Ranges and Dynamic Arrays
Named ranges and dynamic arrays simplify ms excel data analysis, making your spreadsheets clearer and more flexible. Assign a name to a range (Formulas > Name Manager), then use it in formulas: =SUM(SalesData) instead of cell references.
Dynamic array functions like UNIQUE, FILTER, and SORT automate data tasks. For unique values: =UNIQUE(A2:A100). To filter data: =FILTER(B2:B100,C2:C100="Active"). Sorting is as simple as =SORT(D2:D100).
These tools enable dynamic summary tables and cleaner formulas. With named ranges and dynamic arrays, ms excel data analysis becomes more efficient and easier to maintain.
Data Analysis Tools and Techniques in Excel
Unlocking the full potential of ms excel data analysis starts with understanding the right tools and techniques. Excel 2025 offers a robust set of features for beginners to explore, each designed to help you transform raw data into meaningful insights. Let’s take a closer look at these essential methods.
Sorting, Filtering, and Conditional Formatting
Sorting and filtering are fundamental ms excel data analysis techniques. Sorting lets you organize data, such as arranging sales from highest to lowest, while filtering helps you focus on specific criteria, like overdue invoices. Conditional formatting visually highlights patterns or outliers, making trends instantly recognizable.
For a deeper dive, see this Excel Conditional Formatting Guide to master this powerful tool. Using these features together, you can quickly spot issues, prioritize tasks, and extract key insights from even the largest spreadsheets.
Creating and Using Excel Tables
Excel tables are essential for structured ms excel data analysis. Turning your data range into a table adds built-in filters, automatic formatting, and easier referencing. Tables also expand automatically as you add new rows, reducing manual updates.
To create a table, select your data, then choose “Insert Table.” Give your table a clear name for easy navigation. Tables improve clarity, prevent errors, and make formulas more intuitive, especially for beginners managing growing datasets.
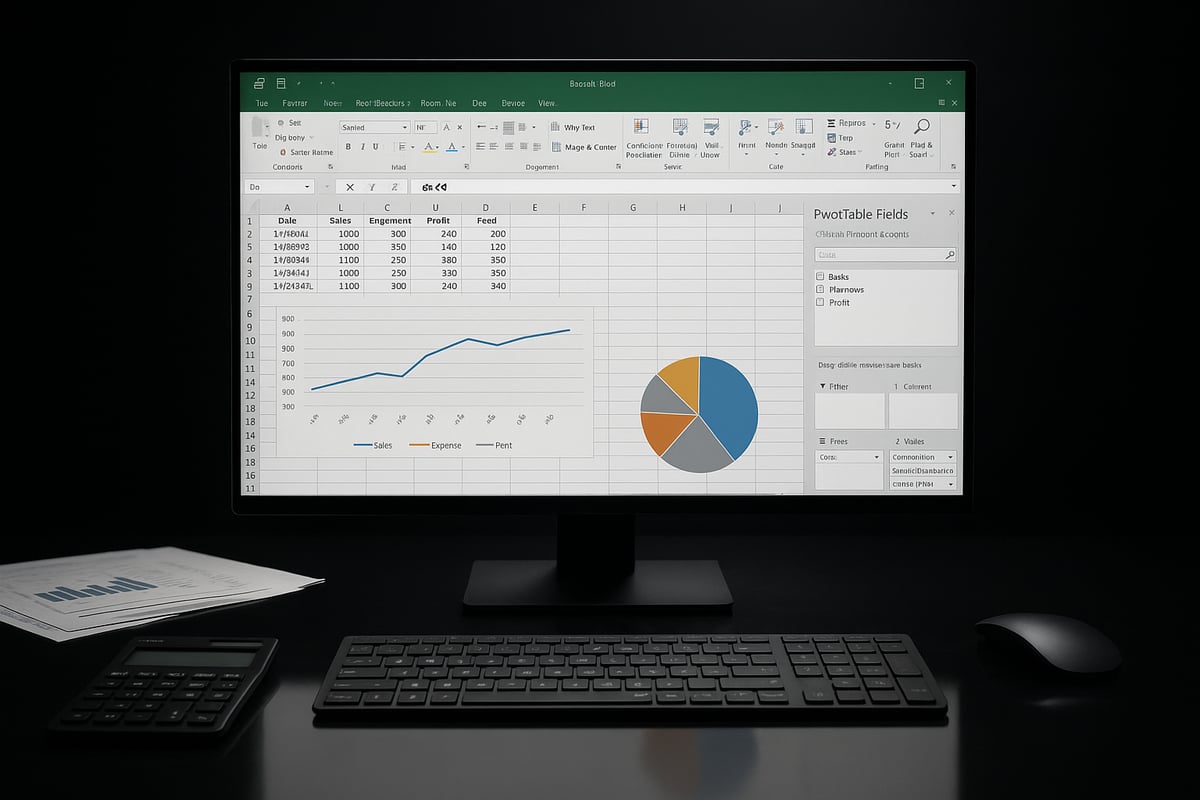
PivotTables: The Beginner’s Power Tool
PivotTables are a cornerstone of ms excel data analysis. They allow you to summarize, group, and analyze large datasets with just a few clicks. Start by selecting your data and choosing “Insert PivotTable.” Drag fields into rows, columns, and values to instantly view totals, averages, or counts by category.
For example, you can create a PivotTable to summarize sales by region or product. This flexibility makes PivotTables an invaluable tool for uncovering trends and making data-driven decisions without complex formulas.
Data Visualization: Charts and Graphs
Charts and graphs are vital for ms excel data analysis, turning numbers into visuals that are easy to interpret. Excel offers a wide variety of chart types, including bar, line, pie, and scatter plots. To create a chart, select your data, then use the “Insert” tab to choose the best visualization for your needs.
Customize your chart by adding titles, labels, and adjusting colors to highlight key findings. Visualizations help communicate insights clearly, making your analysis more impactful for any audience.
Using Excel’s Quick Analysis Tool
The Quick Analysis tool streamlines ms excel data analysis by providing instant access to formatting, charts, and summary calculations. Simply select your data and click the “Quick Analysis” icon that appears. Choose from options like conditional formatting, totals, tables, or charts.
This feature is perfect for beginners who want fast, reliable results without memorizing complex steps. With one click, you can apply popular analysis techniques and visualize data trends in seconds.
Introduction to Data Analysis Toolpak
Excel’s Data Analysis Toolpak expands ms excel data analysis capabilities with advanced statistical tools. To activate it, go to “Add-ins” and enable the Toolpak. Once activated, you gain access to functions like descriptive statistics, histograms, and regression analysis.
These tools are ideal for users who want to move beyond basic summaries and explore deeper trends or relationships in their data. The Toolpak helps transform Excel into a more powerful analytics platform for beginners and growing analysts alike.
Get Expert Excel Help and Training
Sometimes ms excel data analysis can feel overwhelming, especially when tackling complex problems or large datasets. If you need hands-on guidance, personalized training, or troubleshooting, expert support can make a big difference.

The Analytics Doctor provides tailored Excel help, from fixing formulas and automating reports to cleaning up messy data. This resource is perfect for beginners ready to master ms excel data analysis with confidence and efficiency.
Best Practices and Tips for Effective Excel Data Analysis
Unlocking efficiency in ms excel data analysis starts with a well-organized workbook. Clear structure not only saves time but also reduces errors and confusion as your data grows.
Organizing Your Workbook for Clarity
To achieve clarity in ms excel data analysis, always use descriptive sheet names that reflect their content. Color-coding tabs helps you spot key sections at a glance.
Separate raw data, calculations, and final outputs into different sheets. For example, one sheet could hold imported sales data, another your analysis, and a third your charts. Add brief documentation or comments to explain your approach and any assumptions.
A well-structured workbook makes collaboration easier and ensures you can revisit your analysis months later without confusion.
Protecting and Backing Up Your Data
Data security is crucial in ms excel data analysis. Use version control by saving incremental copies of your file, especially before making major changes.
Excel’s password protection can prevent unauthorized edits. Store backups in secure cloud storage like OneDrive or Google Drive for extra protection.
Regularly back up your work to avoid accidental loss from crashes or overwrites. Implementing these habits will keep your valuable data safe and accessible.
Avoiding Common Data Analysis Mistakes
Even experienced users make mistakes in ms excel data analysis. Double-check your formulas to catch typos or incorrect references.
Avoid hardcoding values directly into formulas, as this can lead to errors when data changes. Validate results by comparing outputs with sample data or using built-in auditing tools.
For example, cross-check totals with manual calculations. Taking time to review your work reduces costly errors and boosts confidence in your findings.
Improving Efficiency with Shortcuts and Templates
Speed and consistency are vital in ms excel data analysis. Learn essential keyboard shortcuts, such as Ctrl + Shift + L to toggle filters or Ctrl + T to create tables.
Templates can jumpstart your workflow by providing ready-made structures for common tasks. Many educators use real-time Excel templates for classroom analysis, as seen in Real-Time Excel Analysis in Education.
Explore Excel’s template gallery or reputable online sources to save time and reduce repetitive setup.
Collaborating and Sharing Results in Excel
Collaboration is at the heart of ms excel data analysis projects. Use comments and track changes to communicate with team members.
Share your workbook via OneDrive or SharePoint for real-time editing. Export key findings as PDFs or interactive dashboards to reach a wider audience.
Always clarify which version is the latest, and summarize results in a dedicated sheet for easy reference. Clear communication ensures everyone stays aligned.
Staying Updated with Excel 2025 Features
Excel evolves each year, and staying current enhances your ms excel data analysis skills. The 2025 update introduces smarter data connectors, AI-driven suggestions, and improved charting tools.
Refer to resources like Excel Usage Statistics 2025 to understand how new features are transforming workflows. Explore Microsoft’s learning hub and official release notes for hands-on tutorials.
Integrating the latest tools can significantly boost your productivity and data insights.
Resources for Continued Learning
Continuous learning is key to mastering ms excel data analysis. Start with Microsoft Learn for foundational tutorials and guided exercises.
Recommended books include “Excel Data Analysis for Beginners” and “Pivot Table Data Crunching.” Online platforms like YouTube and Coursera offer free and paid courses.
Join Excel community forums to ask questions and share experiences. Investing in ongoing education will keep your skills sharp and up to date.