Unlocking insights from data is crucial for making smart decisions in business and academic research. Understanding how variables relate to each other can reveal patterns that drive performance and innovation.
The correlation coefficient is one of the most powerful tools for quantifying these relationships. It helps professionals measure the strength and direction of connections between different factors, guiding data-driven choices.
This expert guide will show you exactly how to find the correlation coefficient in Excel using the latest features available in 2026. You will gain a clear, step-by-step understanding, whether you are new to Excel or looking to refine your analytical skills.
In this article, you will discover:
- The fundamentals of correlation and its significance
- Best practices for preparing your data
- How to use Excel’s functions and tools for analysis
- Methods for interpreting and troubleshooting results
- Advanced tips and resources for deeper learning
Start your journey to mastering how to find the correlation coefficient in Excel and turn your data into actionable knowledge.
Understanding Correlation and the Correlation Coefficient
Understanding relationships within data is crucial for anyone learning how to find the correlation coefficient in excel. Correlation measures how two variables move together, making it essential for data-driven decision-making. In business, for example, you might analyze sales and advertising spend to see if they rise or fall together. There are three main types of correlation: positive (both variables increase), negative (one increases as the other decreases), and zero (no relationship). Over 80% of data-driven businesses use correlation analysis to inform key decisions. It is vital to remember that correlation does not imply causation, so results should always be interpreted with care. For a deeper dive into statistical methods, see Excel data analysis techniques.

What is Correlation?
Correlation is a statistical concept that quantifies the relationship between two variables. If you want to know how to find the correlation coefficient in excel, start by understanding these relationships. Positive correlation means that as one variable increases, so does the other, like temperature and ice cream sales. Negative correlation occurs when one variable rises as the other falls, such as exercise time and body fat percentage. Zero correlation means there is no consistent relationship, like shoe size and reading ability. In both business and research, correlation analysis is critical for identifying trends and guiding decisions. Always keep in mind that correlation does not establish causation.
The Correlation Coefficient Explained
The correlation coefficient, often called Pearson’s r, is the most common measure when exploring how to find the correlation coefficient in excel. It ranges from -1 (perfect negative) to +1 (perfect positive), with 0 showing no linear relationship. For example, if you have a dataset of study hours and test scores, a value near +1 means more hours tend to yield higher scores. The formula for Pearson’s r is the covariance of the variables divided by the product of their standard deviations. Alternatives like Spearman and Kendall coefficients are used for ordinal or non-linear data, offering flexibility for different types of analysis.
Why Use Excel for Correlation Analysis?
Excel remains the go-to tool for professionals exploring how to find the correlation coefficient in excel. Its accessibility, user-friendly interface, and robust statistical functions make it ideal for both beginners and experienced analysts. Unlike R or Python, Excel does not require programming skills, so anyone can quickly perform correlation analysis. According to a 2025 survey, 92% of analysts use Excel for at least part of their statistical workflow. Excel’s data visualization tools, such as scatter plots and trendlines, allow users to see relationships clearly. Whether you are new to statistics or an advanced user, Excel accommodates all skill levels.
Types of Correlation Coefficients in Excel
When learning how to find the correlation coefficient in excel, it is important to know which method to use. Excel 2026 offers Pearson, Spearman, and Kendall coefficients. Use Pearson for continuous, normally distributed data, Spearman for ranked or ordinal data, and Kendall for small sample sizes or when data contains ties. For example, Pearson is best for height and weight, while Spearman suits customer satisfaction rankings. Each method has limitations; Excel’s built-in functions may not handle complex data structures. Excel 2026 introduces enhancements for easier selection and visualization of correlation types directly within the analysis tools.
Preparing Your Data for Correlation Analysis in Excel
Preparing your dataset is the foundation of accurate correlation analysis. Before you learn how to find the correlation coefficient in excel, it is essential to ensure your data is structured, clean, and ready for statistical evaluation. Let’s explore the key steps for optimal results.
Data Requirements and Best Practices
To successfully master how to find the correlation coefficient in excel, start with paired, numerical datasets. Each row should represent a single observation, with variables placed in adjacent columns. Avoid mixing text or categories in columns meant for numbers.
A clean dataset means no missing entries and consistent formatting. Sample size matters: small samples can give misleading results, so aim for at least 30 pairs for reliability.
Best practices for organizing data:
- Use clear headers for each variable.
- Place data in adjacent columns, such as A and B.
- Keep all pairs aligned by row for accurate calculations.
- Avoid blank rows or merged cells.
Here’s an example of well-structured data:
| Variable A | Variable B |
|---|---|
| 10 | 15 |
| 12 | 18 |
| 14 | 22 |
Following these steps ensures your data is ready before you proceed with how to find the correlation coefficient in excel.
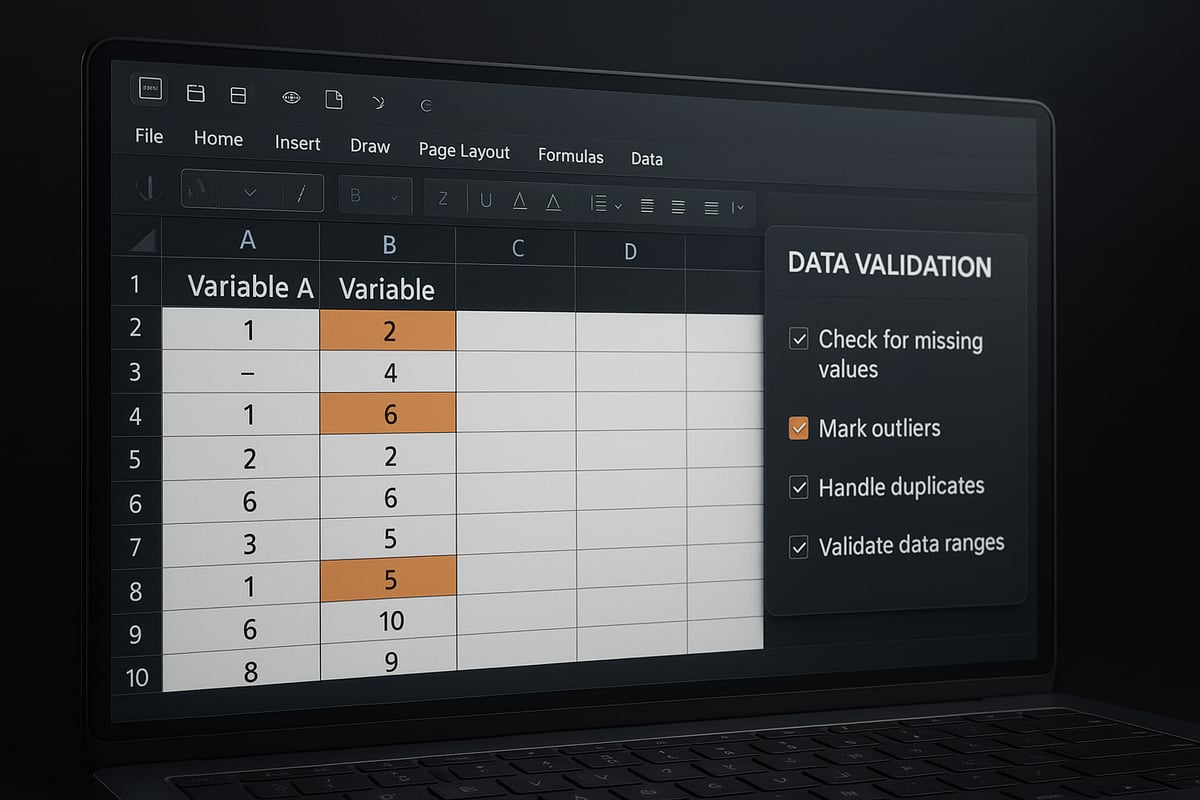
Identifying and Handling Outliers
Outliers are unusual values that stand far from other data points. They can skew results when you try how to find the correlation coefficient in excel, sometimes creating false impressions of strength or direction.
Spotting outliers in Excel is straightforward. Use filters to sort values, or apply conditional formatting to highlight cells that are much higher or lower than the average. Once identified, consider these options:
- Remove the outlier if it’s due to error.
- Winsorize: replace extreme values with the nearest within a defined range.
- Transform: apply log or square root to reduce impact.
For example, removing a single outlier from a sales dataset can shift a weak correlation to moderate. Up to 15% of correlation errors in Excel occur because outliers go unchecked. Always document your decision and test results with and without outliers to understand their effect when learning how to find the correlation coefficient in excel.
Dealing with Missing Data
Missing data can distort your findings when you attempt how to find the correlation coefficient in excel. If pairs are incomplete, Excel’s functions may skip or misinterpret the data.
There are several approaches:
- Deletion: Remove any row with missing data. This is simple but can reduce your sample size.
- Imputation: Fill gaps with averages, medians, or predicted values.
- Ignore blanks: Some Excel functions let you skip blanks, but only if data is structured correctly.
Suppose your dataset has blanks in Variable B. If you delete those rows, your remaining data stays paired. Imputation keeps more data but may introduce bias. Excel 2026 introduces enhanced data cleaning tools, making it easier to flag and address missing values automatically. Always choose the method that maintains data integrity as you pursue how to find the correlation coefficient in excel.
Ensuring Data Consistency and Formatting
Consistent formatting is crucial for error-free calculations when you’re focused on how to find the correlation coefficient in excel. Numeric columns should contain only numbers, without stray text or date formats.
Leverage Excel’s data validation features to restrict input types and use formatting tools to standardize decimals or currency. Here’s a quick checklist:
- Ensure all data is numeric.
- Scan for errors or text in number columns.
- Align decimal places for uniformity.
- Use cell formatting to highlight inconsistencies.
Automating these checks saves time and prevents mistakes. For a detailed guide on setting up validation rules and automated checks, see Data validation rules and checks. Proper formatting and validation empower you to confidently move forward with how to find the correlation coefficient in excel.
Step-by-Step Guide: Finding the Correlation Coefficient in Excel 2026
Unlocking data insights starts with knowing how to find the correlation coefficient in Excel. Excel 2026 makes this process accessible for everyone, from beginners to advanced analysts. In this step-by-step guide, you will learn practical methods, visualization techniques, automation tips, and troubleshooting strategies to ensure your analysis is accurate and reliable.
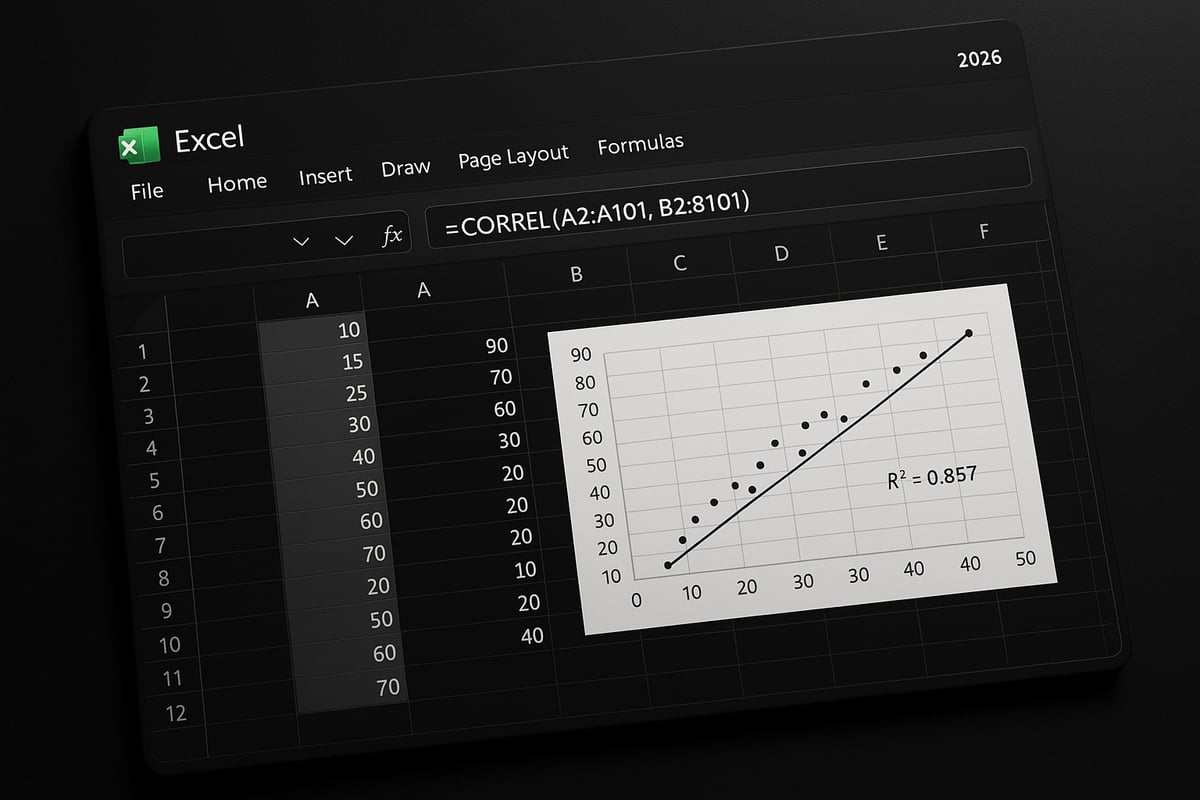
Using the CORREL Function
The CORREL function is the fastest way to learn how to find the correlation coefficient in Excel. This built-in formula calculates Pearson's correlation coefficient between two data ranges. To use it, your data must be paired and numeric.
Syntax:
=CORREL(array1, array2)
For example, if your variables are in columns A and B from rows 2 to 101, you would enter:
=CORREL(A2:A101, B2:B101)
Be sure both ranges are the same length. If not, Excel will return an error.
Here’s a quick checklist to avoid common mistakes when using how to find the correlation coefficient in Excel:
- Always check for missing or non-numeric values.
- Name your data ranges for clarity (e.g., Sales, Advertising).
- Confirm columns are aligned and data is clean.
In Excel 2026, the CORREL function remains unchanged, but improved range selection and error prompts help prevent mistakes. For more details on syntax and troubleshooting, see the CORREL function – Microsoft Support page.
Calculating Correlation with the Data Analysis Toolpak
Another essential method for how to find the correlation coefficient in Excel is through the Data Analysis Toolpak. This add-in enables batch analysis and is perfect for comparing multiple variables at once.
To enable the Toolpak:
- Go to File > Options > Add-ins.
- Select Analysis Toolpak and click Go.
- Check the box and click OK.
Once enabled, follow these steps:
- Click Data tab, then Data Analysis.
- Choose Correlation from the list.
- Select your input data range (include headers for clarity).
- Specify if your data is grouped by columns or rows.
The output is a correlation matrix, showing coefficients for each variable pair. This method is ideal for how to find the correlation coefficient in Excel when working with three or more variables.
Advantages:
- Analyze multiple relationships at once.
- Output is easy to interpret.
- Works well for large datasets.
Limitations include availability in certain Excel editions and potential errors if data is not properly formatted. Always double-check your input before running the analysis.
Visualizing Correlation with Scatter Plots
Visualization is a powerful complement to how to find the correlation coefficient in Excel. Scatter plots illustrate the direction and strength of a relationship, making patterns and outliers easy to spot.
To create a scatter plot:
- Select your paired data columns.
- Go to Insert > Charts > Scatter.
- Choose the basic scatter plot.
Once plotted, right-click any data point and select Add Trendline. Check the options to display the equation and R-squared value on the chart. The R-squared value gives a sense of how well the data fits a linear trend, supporting your correlation findings.
For example, plotting sales against advertising spend quickly reveals if increased spend correlates with higher sales. This approach visually reinforces how to find the correlation coefficient in Excel and helps communicate results effectively.
Scatter plots also make it easier to explain findings to non-technical audiences. They highlight trends, clusters, and any anomalies that might impact your analysis.
Using the PEARSON Function and Other Alternatives
Besides CORREL, Excel offers the PEARSON function as another method for how to find the correlation coefficient in Excel. PEARSON also calculates Pearson’s r, using similar syntax:
=PEARSON(array1, array2)
For most cases, CORREL and PEARSON return identical results, but PEARSON is sometimes preferred for legacy compatibility or in complex formulas.
Comparison Table:
| Function | Output | Use Case |
|---|---|---|
| CORREL | Pearson's r | Standard correlation |
| PEARSON | Pearson's r | Legacy/advanced formulas |
Other useful functions include COVARIANCE.P and COVARIANCE.S for measuring covariance, which is foundational in understanding correlation. Use PEARSON if your workflow or documentation specifies it, but for most users learning how to find the correlation coefficient in Excel, CORREL is straightforward and widely recommended.
Automating Correlation Analysis with Formulas and Macros
When you need to repeat correlation analysis or handle large datasets, automation is key. Excel tables and named ranges allow you to set up dynamic formulas, so your correlation updates automatically with new data.
For advanced users, simple VBA macros can automate how to find the correlation coefficient in Excel across multiple sheets or files. Example macro:
Sub CalculateCorrelation()
    MsgBox Application.WorksheetFunction.Correl(Range("A2:A101"), Range("B2:B101"))
End Sub
Excel 2026 introduces improved macro recording and integration with Power Automate, making batch correlation tasks even easier.
Automation saves time, reduces manual errors, and ensures consistency, especially when applying how to find the correlation coefficient in Excel in business workflows.
Troubleshooting Common Errors in Correlation Calculations
Even with clear steps, errors can occur when learning how to find the correlation coefficient in Excel. Common issues include:
- #N/A: Mismatched range lengths or missing values.
- #DIV/0!: One or both datasets have zero variance.
- Non-numeric data: Text or date values in numeric columns.
Troubleshooting Checklist:
- Confirm both ranges have equal length.
- Check for blanks or errors in data.
- Ensure all values are numeric.
According to a competitor, 40 percent of support queries are formula errors. If you encounter persistent issues, revisit your data preparation and review Excel’s error messages. For ongoing help, explore Excel’s built-in help or trusted community forums.
Interpreting and Applying Correlation Results
Understanding your correlation results is crucial for drawing meaningful insights from your analysis. After learning how to find the correlation coefficient in Excel, the next step is to interpret what those numbers mean for your business or research decisions. This section breaks down interpretation, statistical significance, analysis pitfalls, and best practices for reporting your findings.
Understanding the Meaning of Your Coefficient
Interpreting correlation coefficients is foundational to understanding your data relationships. The correlation coefficient, found using how to find the correlation coefficient in Excel, shows both the direction and strength of a relationship.
- Positive values (0 to +1): Variables move together. For example, as marketing spend increases, sales may rise.
- Negative values (0 to -1): One variable increases as the other decreases, such as study hours and error rates.
- Zero: No linear relationship exists.
| Coefficient Range | Strength | Example Use Case |
|---|---|---|
| 0.1 – 0.3 | Weak | Social media activity vs. sales |
| 0.3 – 0.7 | Moderate | Training hours vs. productivity |
| 0.7 – 1.0 | Strong | Advertising spend vs. revenue |
Always interpret coefficients in context. For a practical walkthrough of scatter plots and coefficient meaning, see Creating Scatterplots and Finding Correlation Coefficient – Excel Explained: Definition, Examples, Practice & Video Lessons.
Statistical Significance and P-Values in Excel
After you learn how to find the correlation coefficient in Excel, it is essential to determine if your results are statistically significant. Statistical significance tells you whether the observed relationship is likely due to chance.
To assess significance, calculate the p-value. In Excel, you can use the T.TEST function or related formulas to test if your correlation is reliable. Generally, a p-value less than 0.05 indicates a significant correlation.
For example, if your analysis of sales and online ad spend returns a coefficient of 0.65 with a p-value of 0.03, you can be confident the correlation is not random. Remember, statistical significance is critical in business and research reporting to avoid misleading conclusions.
Limitations and Pitfalls of Correlation Analysis
While mastering how to find the correlation coefficient in Excel gives you valuable insights, be cautious about overinterpreting results. Correlation does not prove causation. Factors like confounding variables or spurious relationships can mislead you.
For instance, both ice cream sales and drowning incidents may increase during summer, but one does not cause the other. Also, linear correlation misses nonlinear patterns. Always consider additional analyses, such as regression or partial correlation, to deepen your understanding and avoid common pitfalls.
Presenting and Reporting Correlation Findings
Clear communication of your correlation results is vital. When showing how to find the correlation coefficient in Excel, back up your findings with well-designed tables, annotated scatter plots, and concise summaries.
Best practices include:
- Using simple tables to display coefficients and p-values
- Adding trendlines and labels to scatter plots for clarity
- Writing a brief narrative explaining what the numbers mean for your audience
For formal reports, structure your findings by context, methodology, and key insights. Avoid jargon and ensure your results are accessible to non-technical stakeholders. Careful presentation helps drive informed decisions based on your Excel analysis.
Advanced Correlation Techniques and Excel 2026 Enhancements
Unlocking deeper insights in your data often requires advanced tools and techniques. If you want to master how to find the correlation coefficient in excel, exploring the latest capabilities in Excel 2026 is essential. Below, we break down the most powerful ways to expand your correlation analysis.
Multiple Variable Correlation Matrices
Analyzing the relationships among several variables at once is crucial for comprehensive data analysis. In Excel 2026, you can create a correlation matrix to display all pairwise correlation coefficients in a single table. To do this, organize your data with each variable in its own column, then use the Data Analysis Toolpak’s Correlation feature or the new Matrix Correlation function.
A typical workflow involves:
- Selecting your data range
- Launching the Toolpak and choosing ‘Correlation’
- Reviewing the output matrix, where rows and columns represent your variables
You can enhance interpretation by applying conditional formatting or by visualizing results with heatmaps. Excel 2026 introduces improved matrix visualization options, making it easier to spot strong or weak correlations. For the latest details on these enhancements, see What’s New in Excel (January 2026). Using these new features, you will elevate how to find the correlation coefficient in excel for multi-variable scenarios.
Nonlinear and Nonparametric Correlation Methods
Linear correlation is not always enough, especially with ranked or non-normally distributed data. Excel 2026 supports both Spearman and Kendall correlation methods, which are designed for ordinal or non-linear datasets. Use Spearman when your data is ranked or not evenly spaced, and Kendall for small samples or when you need a robust approach to tied ranks.
To apply these methods:
- Organize your data in two columns
- Use the new built-in functions for Spearman or Kendall, or access them via the Toolpak
Excel 2026 streamlines the process, allowing you to select the method best suited for your data’s structure. By understanding how to find the correlation coefficient in excel with these nonparametric tools, you gain more accurate insights in diverse analytical situations.
Automating and Scaling Correlation Analysis
When you are working with large datasets or repeating correlation analysis across multiple sheets, automation is key. Excel 2026 offers enhanced support for dynamic arrays, table references, and macros, making it easier to automate your workflow. For example, you can use VBA macros to calculate correlations across dozens of variable pairs at once, reducing manual effort and minimizing errors.
A scalable approach might include:
- Structuring your data in tables with named ranges
- Writing a macro to loop through variable combinations
- Outputting results into a summary matrix
Explore Excel VBA programming for automation to boost your skills in automating how to find the correlation coefficient in excel for complex projects.
Integrating Correlation Analysis with Other Excel Tools
Advanced data analysis does not stop at correlation. In Excel 2026, you can seamlessly combine correlation results with regression, forecasting, or dashboarding tools. For instance, use your correlation matrix to identify variables to include in a regression model, or visualize findings through Power BI dashboards.
Benefits of integration include:
- Faster decision-making
- Streamlined reporting
- More robust analytical workflows
With improved analytics capabilities, Excel 2026 makes it easier than ever to leverage how to find the correlation coefficient in excel as a foundation for more comprehensive business intelligence.
Expert Resources and Further Learning
Unlocking how to find the correlation coefficient in excel requires more than just basic know-how. To truly master this skill for business or academic success, you need access to expert resources and ongoing learning opportunities. Explore the following curated recommendations to deepen your expertise, troubleshoot confidently, and stay current with Excel’s evolving features.
Recommended Excel Training and Tutorials
To build a strong foundation in how to find the correlation coefficient in excel, start with top-rated courses and tutorials. Video-based learning remains the most popular path, with over 70% of Excel learners choosing this format for its visual clarity and step-by-step guidance.
- DataCamp’s Excel CORREL(): Analyze Relationships Between Variables in Excel | DataCamp: This tutorial provides hands-on practice, clear explanations, and sample datasets for the CORREL function.
- Microsoft Learn: Official modules on Excel statistics, perfect for structured, self-paced study.
- YouTube Channels: Chandoo, ExcelIsFun, and Leila Gharani offer in-depth, up-to-date walkthroughs on statistical analysis in Excel.
- Coursera and LinkedIn Learning: Comprehensive courses covering everything from basics to advanced analytics.
These resources will help you confidently navigate how to find the correlation coefficient in excel, whether you are a beginner or seeking advanced expertise.
Excel Help from The Analytics Doctor
If you ever feel stuck on how to find the correlation coefficient in excel, personalized support can make all the difference. The Analytics Doctor is a trusted expert resource offering:

- Hands-on troubleshooting for formula errors or data inconsistencies
- Custom training tailored to your business or academic needs
- Advanced solutions, including automation and complex analytics
- Free guides and step-by-step tutorials for all skill levels
Whether you are preparing a major report or need ongoing support, The Analytics Doctor provides the expertise to help you tackle complex correlation and data analysis challenges in Excel. Their practical approach ensures you build lasting skills in how to find the correlation coefficient in excel.
Books and Reference Materials on Excel Statistics
Printed guides remain indispensable for those who prefer in-depth, structured learning about how to find the correlation coefficient in excel. Some of the most respected titles include:
| Book Title | Best For |
|---|---|
| Excel Data Analysis for Dummies | Beginners, fundamentals |
| Microsoft Excel Data Analysis and Business Modeling | Intermediate, practical use |
| Statistical Analysis: Microsoft Excel 2026 | Advanced, reference |
| Excel Bible | Comprehensive, all levels |
These books cover topics from basic correlation analysis to advanced statistical modeling, making them ideal for ongoing reference and mastery of how to find the correlation coefficient in excel.
Community Forums and Peer Support
Sometimes, the fastest way to solve a tricky problem in how to find the correlation coefficient in excel is by tapping into community knowledge. More than 50% of Excel users rely on forums for peer troubleshooting and real-world advice.
- Microsoft Tech Community: Direct access to Excel experts and official support.
- Reddit r/excel: Lively discussions, user-shared solutions, and quick feedback.
- Stack Overflow: Ideal for technical questions and coding-related Excel issues.
- MrExcel Forums: One of the longest-running Excel communities, rich with archived solutions.
By engaging with these communities, you gain practical insights and can share your own tips for how to find the correlation coefficient in excel.